XM Radio 2010 Annual Report Download - page 80
Download and view the complete annual report
Please find page 80 of the 2010 XM Radio annual report below. You can navigate through the pages in the report by either clicking on the pages listed below, or by using the keyword search tool below to find specific information within the annual report.-
 1
1 -
2
-
3
-
4
-
5
-
6
-
7
-
8
-
9
-
10
-
11
-
12
-
13
-
14
-
15
-
16
-
17
-
18
-
19
-
20
-
21
-
22
-
23
-
24
-
25
-
26
-
27
-
28
-
29
-
30
-
31
-
32
-
33
-
34
-
35
-
36
-
37
-
38
-
39
-
40
-
41
-
42
-
43
-
44
-
45
-
46
-
47
-
48
-
49
-
50
-
51
-
52
-
53
-
54
-
55
-
56
-
57
-
58
-
59
-
60
-
61
-
62
-
63
-
64
-
65
-
66
-
67
-
68
-
69
-
 70
70 -
 71
71 -
 72
72 -
 73
73 -
 74
74 -
 75
75 -
 76
76 -
 77
77 -
 78
78 -
 79
79 -
 80
80 -
 81
81 -
 82
82 -
 83
83 -
 84
84 -
 85
85 -
 86
86 -
 87
87 -
 88
88 -
 89
89 -
 90
90 -
91
-
92
-
93
-
94
-
95
-
96
-
97
-
98
-
99
-
100
-
101
-
102
-
103
-
104
-
105
-
106
-
107
-
108
-
109
-
110
-
111
-
112
-
113
-
114
-
115
-
116
-
117
-
118
-
119
-
120
-
121
-
122
-
123
-
124
-
125
-
126
-
127
-
128
-
129
-
130
-
131
-
132
-
133
-
134
-
135
-
136
 |
 |

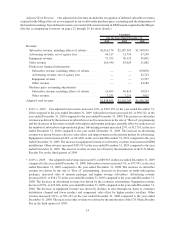
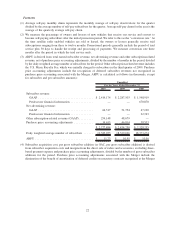
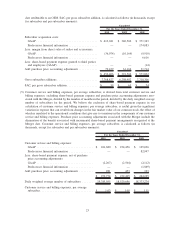
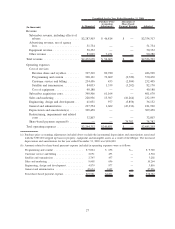
(6) Free cash flow is calculated as follows (in thousands):
2010 2009 2008
For The Years Ended December 31,
Unaudited
Net cash provided by operating activities:
GAAP . ....................................... $512,895 $ 433,830 $(152,797)
Predecessor financial information .................... — — (251,086)
Additions to property and equipment:
GAAP . ....................................... (311,868) (248,511) (130,551)
Predecessor financial information .................... (30,843)
Merger related costs:
GAAP . ....................................... — — (23,519)
Predecessor financial information .................... — — —
Restricted and other investment activity:
GAAP . ....................................... 9,454 — 62,974
Predecessor financial information .................... (25,949)
Free cash flow .................................... $210,481 $ 185,319 $(551,771)
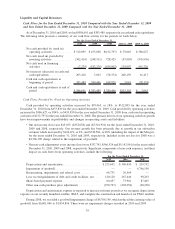
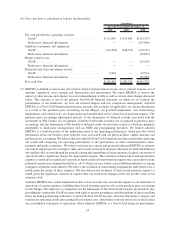
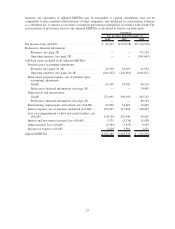
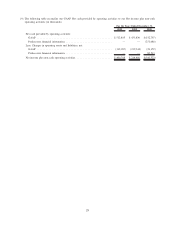
(7) EBITDA is defined as net income (loss) before interest and investment income (loss); interest expense, net of
amounts capitalized; taxes expense and depreciation and amortization. We adjust EBITDA to remove the
impact of other income and expense, loss on extinguishment of debt as well as certain other charges discussed
below. This measure is one of the primary Non-GAAP financial measures on which we (i) evaluate the
performance of our businesses, (ii) base our internal budgets and (iii) compensate management. Adjusted
EBITDA is a Non-GAAP financial performance measure that excludes (if applicable): (i) certain adjustments
as a result of the purchase price accounting for the Merger, (ii) goodwill impairment, (iii) restructuring,
impairments, and related costs, (iv) depreciation and amortization and (v) share-based payment expense. The
purchase price accounting adjustments include: (i) the elimination of deferred revenue associated with the
investment in XM Canada, (ii) recognition of deferred subscriber revenues not recognized in purchase price
accounting, and (iii) elimination of the benefit of deferred credits on executory contracts, which are primarily
attributable to third party arrangements with an OEM and programming providers. We believe adjusted
EBITDA is a useful measure of the underlying trend of our operating performance, which provides useful
information about our business apart from the costs associated with our physical plant, capital structure and
purchase price accounting. We believe investors find this Non-GAAP financial measure useful when analyzing
our results and comparing our operating performance to the performance of other communications, enter-
tainment and media companies. We believe investors use current and projected adjusted EBITDA to estimate
our current and prospective enterprise value and to make investment decisions. Because we fund and build-out
our satellite radio system through the periodic raising and expenditure of large amounts of capital, our results of
operations reflect significant charges for depreciation expense. The exclusion of depreciation and amortization
expense is useful given significant variation in depreciation and amortization expense that can result from the
potential variations in estimated useful lives, all of which can vary widely across different industries or among
companies within the same industry. We believe the exclusion of restructuring, impairments and related costs is
useful given the nature of these expenses. We also believe the exclusion of share-based payment expense is
useful given the significant variation in expense that can result from changes in the fair market value of our
common stock.
Adjusted EBITDA has certain limitations in that it does not take into account the impact to our statement of
operations of certain expenses, including share-based payment expense and certain purchase price accounting
for the Merger. We endeavor to compensate for the limitations of the Non-GAAP measure presented by also
providing the comparable GAAP measure with equal or greater prominence and descriptions of the reconciling
items, including quantifying such items, to derive the Non-GAAP measure. Investors that wish to compare and
evaluate our operating results after giving effect for these costs, should refer to net income (loss) as disclosed in
our consolidated statements of operations. Since adjusted EBITDA is a Non-GAAP financial performance
24