XM Radio 2010 Annual Report Download - page 59
Download and view the complete annual report
Please find page 59 of the 2010 XM Radio annual report below. You can navigate through the pages in the report by either clicking on the pages listed below, or by using the keyword search tool below to find specific information within the annual report.-
 1
1 -
2
-
3
-
4
-
5
-
6
-
7
-
8
-
9
-
10
-
11
-
12
-
13
-
14
-
15
-
16
-
17
-
18
-
19
-
20
-
21
-
22
-
23
-
24
-
25
-
26
-
27
-
28
-
29
-
30
-
31
-
32
-
33
-
34
-
35
-
36
-
37
-
38
-
39
-
40
-
41
-
42
-
43
-
44
-
45
-
46
-
47
-
48
-
 49
49 -
 50
50 -
 51
51 -
 52
52 -
 53
53 -
 54
54 -
 55
55 -
 56
56 -
 57
57 -
 58
58 -
 59
59 -
 60
60 -
 61
61 -
 62
62 -
 63
63 -
 64
64 -
 65
65 -
 66
66 -
 67
67 -
 68
68 -
 69
69 -
70
-
71
-
72
-
73
-
74
-
75
-
76
-
77
-
78
-
79
-
80
-
81
-
82
-
83
-
84
-
85
-
86
-
87
-
88
-
89
-
90
-
91
-
92
-
93
-
94
-
95
-
96
-
97
-
98
-
99
-
100
-
101
-
102
-
103
-
104
-
105
-
106
-
107
-
108
-
109
-
110
-
111
-
112
-
113
-
114
-
115
-
116
-
117
-
118
-
119
-
120
-
121
-
122
-
123
-
124
-
125
-
126
-
127
-
128
-
129
-
130
-
131
-
132
-
133
-
134
-
135
-
136
 |
 |

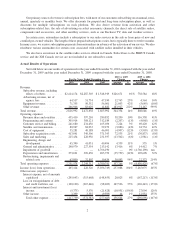
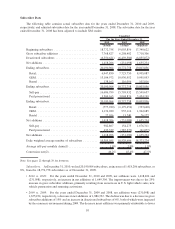
2010 2009 2008 Amount % Amount %
For the Years Ended December 31,
2010 vs 2009
Change
2009 vs 2008
Change
Income (loss) before income
taxes ..................... 47,675 (346,057) (5,314,434) 393,732 114% 4,968,377 93%
Income tax expense . ........... (4,620) (5,981) (2,476) 1,361 23% (3,505) (142)%
Net income (loss) . . ........... 43,055 (352,038) (5,316,910) 395,093 112% 4,964,872 93%
Preferred stock beneficial
conversion feature .......... — (186,188) — 186,188 nm (186,188) nm
Net income (loss) attributable to
common stockholders ......... $ 43,055 $ (538,226) $(5,316,910) $581,281 108% $ 4,778,684 90%
nm — not meaningful
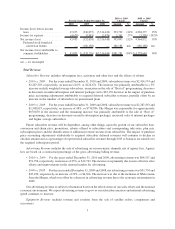
Total Revenue
Subscriber Revenue includes subscription fees, activation and other fees and the effects of rebates.
•2010 vs. 2009: For the years ended December 31, 2010 and 2009, subscriber revenue was $2,414,174 and
$2,287,503, respectively, an increase of 6%, or $126,671. The increase was primarily attributable to a 5%
increase in daily weighted average subscribers, an increase in the sale of “Best of” programming, decreases
in discounts on multi-subscription and internet packages and a $32,159 decrease in the impact of purchase
price accounting adjustments attributable to acquired deferred subscriber revenues, partially offset by an
increase in the number of subscribers on promotional plans.
•2009 vs. 2008: For the years ended December 31, 2009 and 2008, subscriber revenue was $2,287,503 and
$1,548,919, respectively, an increase of 48%, or $738,584. The Merger was responsible for approximately
$670,870 of the increase and the remaining increase was primarily attributable to the sale of “Best of”
programming, decreases in discounts on multi-subscription packages, increased sales of internet packages
and higher average subscribers.
Future subscriber revenue will be dependent, among other things, upon the growth of our subscriber base,
conversion and churn rates, promotions, rebates offered to subscribers and corresponding take-rates, plan mix,
subscription prices and the identification of additional revenue streams from subscribers. The impact of purchase
price accounting adjustments attributable to acquired subscriber deferred revenues will continue to decline in
absolute amount and as a percentage of reported total subscriber revenues through 2013 as balances are earned over
the acquired subscription period.
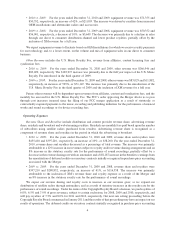
Advertising Revenue includes the sale of advertising on our non-music channels, net of agency fees. Agency
fees are based on a contractual percentage of the gross advertising billing revenue.
•2010 vs. 2009: For the years ended December 31, 2010 and 2009, advertising revenue was $64,517 and
$51,754, respectively, an increase of 25%, or $12,763. The increase was primarily due to more effective sales
efforts and improvements in the national market for advertising.
•2009 vs. 2008: For the years ended December 31, 2009 and 2008, net advertising revenue was $51,754 and
$47,190, respectively, an increase of 10%, or $4,564. The increase was due to the inclusion of XM revenue
from the Merger, which was offset by a decrease in advertising revenue due to the economic environment in
2009.
Our advertising revenue is subject to fluctuation based on the effectiveness of our sales efforts and the national
economic environment. We expect advertising revenue to grow as our subscribers increase and national advertising
spend continues to increase.
Equipment Revenue includes revenue and royalties from the sale of satellite radios, components and
accessories.
3