Seagate 2009 Annual Report Download - page 74
Download and view the complete annual report
Please find page 74 of the 2009 Seagate annual report below. You can navigate through the pages in the report by either clicking on the pages listed below, or by using the keyword search tool below to find specific information within the annual report.-
 1
1 -
2
-
3
-
4
-
5
-
6
-
7
-
8
-
9
-
10
-
11
-
12
-
13
-
14
-
15
-
16
-
17
-
18
-
19
-
20
-
21
-
22
-
23
-
24
-
25
-
26
-
27
-
28
-
29
-
30
-
31
-
32
-
33
-
34
-
35
-
36
-
37
-
38
-
39
-
40
-
41
-
42
-
43
-
44
-
45
-
46
-
47
-
48
-
49
-
50
-
51
-
52
-
53
-
54
-
55
-
56
-
57
-
58
-
59
-
60
-
61
-
62
-
63
-
 64
64 -
 65
65 -
 66
66 -
 67
67 -
 68
68 -
 69
69 -
 70
70 -
 71
71 -
 72
72 -
 73
73 -
 74
74 -
 75
75 -
 76
76 -
 77
77 -
 78
78 -
 79
79 -
 80
80 -
 81
81 -
 82
82 -
 83
83 -
 84
84 -
85
-
86
-
87
-
88
-
89
-
90
-
91
-
92
-
93
-
94
-
95
-
96
-
97
-
98
-
99
-
100
-
101
-
102
-
103
-
104
-
105
-
106
-
107
-
108
-
109
-
110
-
111
-
112
-
113
-
114
-
115
-
116
-
117
-
118
-
119
-
120
-
121
-
122
-
123
-
124
-
125
-
126
-
127
-
128
-
129
-
130
-
131
-
132
-
133
-
134
-
135
-
136
-
137
-
138
-
139
-
140
-
141
-
142
-
143
-
144
-
145
-
146
-
147
-
148
-
149
-
150
-
151
-
152
-
153
-
154
-
155
-
156
-
157
-
158
-
159
-
160
-
161
-
162
-
163
-
164
-
165
-
166
-
167
-
168
-
169
-
170
-
171
-
172
-
173
-
174
-
175
-
176
-
177
-
178
-
179
-
180
-
181
-
182
-
183
-
184
-
185
-
186
-
187
-
188
-
189
-
190
-
191
-
192
-
193
-
194
-
195
-
196
-
197
-
198
-
199
-
200
-
201
-
202
-
203
-
204
-
205
-
206
-
207
-
208
-
209
-
210
-
211
-
212
-
213
-
214
-
215
-
216
-
217
-
218
-
219
-
220
-
221
-
222
-
223
-
224
-
225
-
226
-
227
-
228
-
229
-
230
-
231
-
232
-
233
-
234
-
235
-
236
-
237
-
238
-
239
-
240
-
241
-
242
-
243
-
244
-
245
-
246
-
247
-
248
-
249
-
250
-
251
-
252
 |
 |

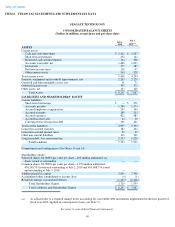
Table of Contents
SEAGATE TECHNOLOGY
CONSOLIDATED STATEMENTS OF CASH FLOWS
(Dollars in millions)
Fiscal Years Ended
July 2,
2010
July 3,
2009
(a)
June 27,
2008
(a)
OPERATING ACTIVITIES
Net income (loss)
$
1,609
$
(3,125
)
$
1,251
Adjustments to reconcile net income (loss) to net cash from
operating activities:
Depreciation and amortization
780
931
844
Stock
-
based compensation
57
83
113
Impairment of goodwill and other long
-
lived assets, net of
recoveries
57
2,320
—
Deferred income taxes
(36
)
306
10
Other non
-
cash operating activities, net
34
8
(4
)
Changes in operating assets and liabilities:
Accounts receivable
(367
)
372
(67
)
Inventories
(170
)
358
(151
)
Accounts payable
2
(79
)
351
Accrued employee compensation
119
(296
)
282
Accrued expenses and warranty
(161
)
(117
)
(128
)
Other assets and liabilities
8
62
37
Net cash provided by operating activities
1,932
823
2,538
INVESTING ACTIVITIES
Acquisition of property, equipment and leasehold improvements
(639
)
(633
)
(930
)
Proceeds from sale of fixed assets
21
7
29
Purchases of short
-
term investments
(373
)
(155
)
(486
)
Sales of short
-
term investments
119
89
333
Maturities of short
-
term investments
114
103
127
(Increase) decrease in restricted cash and investments
15
(128
)
—
Proceeds from liquidation of deferred compensation plan
investments
—
85
—
Proceeds from sale of investments in equity securities
—
11
—
Acquisitions, net of cash and cash equivalents acquired
—
—
(
78
)
Other investing activities, net
(9
)
3
14
Net cash used in investing activities
(752
)
(618
)
(991
)
FINANCING ACTIVITIES
Proceeds from short
-
term borrowings
15
350
—
Net proceeds from issuance of long
-
term debt
587
399
—
Retirements and maturities of short
-
term borrowings
(365
)
—
—
Retirements and maturities of long
-
term debt
(462
)
(55
)
(34
)
(Increase) decrease in restricted cash and investments
379
(380
)
—
Proceeds from exercise of employee stock options and employee
stock purchase plan
86
54
178
Dividends to shareholders
—
(
132
)
(216
)
Repurchases of common shares
(584
)
—
(
1,479
)
Other financing activities, net
—
(
4
)
6
Net cash provided by (used in) financing activities
(344
)
232
(1,545
)
Increase in cash and cash equivalents
836
437
2
Cash and cash equivalents at the beginning of the year
1,427
990
988
Cash and cash equivalents at the end of the year
$
2,263
$
1,427
$
990
Supplemental Disclosure of Cash Flow Information
Cash paid for interest
$
138
$
118
$
121
Cash paid for income taxes, net of refunds
(14
)
10
34
(a) As adjusted due to a required change in the accounting for convertible debt instruments implemented in the first quarter of
fiscal year 2010, applied on a retrospective basis (see Note 5).