Seagate 2009 Annual Report Download - page 68
Download and view the complete annual report
Please find page 68 of the 2009 Seagate annual report below. You can navigate through the pages in the report by either clicking on the pages listed below, or by using the keyword search tool below to find specific information within the annual report.-
 1
1 -
2
-
3
-
4
-
5
-
6
-
7
-
8
-
9
-
10
-
11
-
12
-
13
-
14
-
15
-
16
-
17
-
18
-
19
-
20
-
21
-
22
-
23
-
24
-
25
-
26
-
27
-
28
-
29
-
30
-
31
-
32
-
33
-
34
-
35
-
36
-
37
-
38
-
39
-
40
-
41
-
42
-
43
-
44
-
45
-
46
-
47
-
48
-
49
-
50
-
51
-
52
-
53
-
54
-
55
-
56
-
57
-
 58
58 -
 59
59 -
 60
60 -
 61
61 -
 62
62 -
 63
63 -
 64
64 -
 65
65 -
 66
66 -
 67
67 -
 68
68 -
 69
69 -
 70
70 -
 71
71 -
 72
72 -
 73
73 -
 74
74 -
 75
75 -
 76
76 -
 77
77 -
 78
78 -
79
-
80
-
81
-
82
-
83
-
84
-
85
-
86
-
87
-
88
-
89
-
90
-
91
-
92
-
93
-
94
-
95
-
96
-
97
-
98
-
99
-
100
-
101
-
102
-
103
-
104
-
105
-
106
-
107
-
108
-
109
-
110
-
111
-
112
-
113
-
114
-
115
-
116
-
117
-
118
-
119
-
120
-
121
-
122
-
123
-
124
-
125
-
126
-
127
-
128
-
129
-
130
-
131
-
132
-
133
-
134
-
135
-
136
-
137
-
138
-
139
-
140
-
141
-
142
-
143
-
144
-
145
-
146
-
147
-
148
-
149
-
150
-
151
-
152
-
153
-
154
-
155
-
156
-
157
-
158
-
159
-
160
-
161
-
162
-
163
-
164
-
165
-
166
-
167
-
168
-
169
-
170
-
171
-
172
-
173
-
174
-
175
-
176
-
177
-
178
-
179
-
180
-
181
-
182
-
183
-
184
-
185
-
186
-
187
-
188
-
189
-
190
-
191
-
192
-
193
-
194
-
195
-
196
-
197
-
198
-
199
-
200
-
201
-
202
-
203
-
204
-
205
-
206
-
207
-
208
-
209
-
210
-
211
-
212
-
213
-
214
-
215
-
216
-
217
-
218
-
219
-
220
-
221
-
222
-
223
-
224
-
225
-
226
-
227
-
228
-
229
-
230
-
231
-
232
-
233
-
234
-
235
-
236
-
237
-
238
-
239
-
240
-
241
-
242
-
243
-
244
-
245
-
246
-
247
-
248
-
249
-
250
-
251
-
252
 |
 |

Table of Contents
including property, equipment and leasehold improvements and other intangible assets subject to amortization, for recoverability whenever
events or changes in circumstances indicate that the carrying values of those assets may not be recoverable. We assess the recoverability of an
asset group by determining if the carrying value of the asset group exceeds the sum of the projected undiscounted cash flows expected to result
from the use and eventual disposition of the assets over the remaining economic life of the primary asset in the asset group. If the recoverability
test indicates that the carrying value of the asset group is not recoverable, we will estimate the fair value of the asset group using the same
approaches indicated above for ASC 360 step two and compare it to its carrying value. The excess of the carrying value over the fair value is
allocated pro rata to derive the adjusted carrying value of each asset in the asset group. The adjusted carrying value of each asset in the asset
group is not reduced below its fair value.
Recent Accounting Pronouncements
See Note 1 of our Notes to Consolidated Financial Statements for information regarding the effect of new accounting pronouncements on
our financial statements.
ITEM 7A. QUALITATIVE AND QUANTITATIVE DISCLOSURES ABOUT MARKET RISK
We have exposure to market risks due to the volatility of interest rates, foreign currency exchange rates, equity and bond markets. A portion
of these risks are hedged, but fluctuations could impact our results of operations, financial position and cash flows. Additionally, we have
exposure to downgrades in the credit ratings of our counterparties as well as exposure related to our credit rating changes.
Interest Rate Risk. Our exposure to market risk for changes in interest rates relates primarily to our investment portfolio. At July 2, 2010,
with the exception of our auction rate securities, we had no marketable securities that had been in a continuous unrealized loss position for a
period greater than 12 months and determined that no investments were other-than-temporarily impaired. We currently do not use derivative
financial instruments in our investment portfolio.
We have fixed rate debt obligations. We enter into debt obligations to support general corporate purposes including capital expenditures and
working capital needs. We currently do not use interest rate derivatives to hedge interest rate exposure on our outstanding debt.
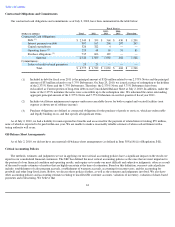
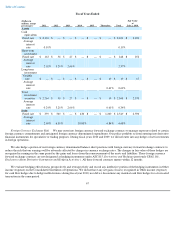
The table below presents principal amounts and related weighted average interest rates by year of maturity for our investment portfolio and
debt obligations as of July 2, 2010. All short-term investments mature in three years or less. Included in short-term debt for fiscal year 2011 is
the principal amount of $326 million related to our 2.375% Notes and $33 million related to our 5.75% Debentures. On June 25, 2010, we called
for the redemption of the remaining notes for both the 2.375% Notes and the 5.75% Debentures. These notes were retired in the first quarter of
fiscal year 2011.
66