Seagate 2009 Annual Report Download - page 58
Download and view the complete annual report
Please find page 58 of the 2009 Seagate annual report below. You can navigate through the pages in the report by either clicking on the pages listed below, or by using the keyword search tool below to find specific information within the annual report.-
 1
1 -
2
-
3
-
4
-
5
-
6
-
7
-
8
-
9
-
10
-
11
-
12
-
13
-
14
-
15
-
16
-
17
-
18
-
19
-
20
-
21
-
22
-
23
-
24
-
25
-
26
-
27
-
28
-
29
-
30
-
31
-
32
-
33
-
34
-
35
-
36
-
37
-
38
-
39
-
40
-
41
-
42
-
43
-
44
-
45
-
46
-
47
-
 48
48 -
 49
49 -
 50
50 -
 51
51 -
 52
52 -
 53
53 -
 54
54 -
 55
55 -
 56
56 -
 57
57 -
 58
58 -
 59
59 -
 60
60 -
 61
61 -
 62
62 -
 63
63 -
 64
64 -
 65
65 -
 66
66 -
 67
67 -
 68
68 -
69
-
70
-
71
-
72
-
73
-
74
-
75
-
76
-
77
-
78
-
79
-
80
-
81
-
82
-
83
-
84
-
85
-
86
-
87
-
88
-
89
-
90
-
91
-
92
-
93
-
94
-
95
-
96
-
97
-
98
-
99
-
100
-
101
-
102
-
103
-
104
-
105
-
106
-
107
-
108
-
109
-
110
-
111
-
112
-
113
-
114
-
115
-
116
-
117
-
118
-
119
-
120
-
121
-
122
-
123
-
124
-
125
-
126
-
127
-
128
-
129
-
130
-
131
-
132
-
133
-
134
-
135
-
136
-
137
-
138
-
139
-
140
-
141
-
142
-
143
-
144
-
145
-
146
-
147
-
148
-
149
-
150
-
151
-
152
-
153
-
154
-
155
-
156
-
157
-
158
-
159
-
160
-
161
-
162
-
163
-
164
-
165
-
166
-
167
-
168
-
169
-
170
-
171
-
172
-
173
-
174
-
175
-
176
-
177
-
178
-
179
-
180
-
181
-
182
-
183
-
184
-
185
-
186
-
187
-
188
-
189
-
190
-
191
-
192
-
193
-
194
-
195
-
196
-
197
-
198
-
199
-
200
-
201
-
202
-
203
-
204
-
205
-
206
-
207
-
208
-
209
-
210
-
211
-
212
-
213
-
214
-
215
-
216
-
217
-
218
-
219
-
220
-
221
-
222
-
223
-
224
-
225
-
226
-
227
-
228
-
229
-
230
-
231
-
232
-
233
-
234
-
235
-
236
-
237
-
238
-
239
-
240
-
241
-
242
-
243
-
244
-
245
-
246
-
247
-
248
-
249
-
250
-
251
-
252
 |
 |

Table of Contents
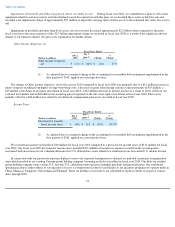
52 weeks in fiscal year 2008, $20 million in operating expenses resulting from increased product development and licensing activities, and
$26 million of accelerated depreciation expense related to the closure of our Pittsburgh facility.
Marketing and Administrative Expense. The decrease in marketing and administrative expense for fiscal year 2009 was primarily due to
$53 million of variable performance-based compensation expense in fiscal year 2008 while none was recognized in fiscal year 2009. In the
second half of the fiscal year 2009, restructuring and other cost reduction efforts contributed to further reductions of $25 million in wages,
$29 million for reduced use of consultants and outside services, and $15 million as a result of reduced travel. Additionally, other employee
benefits decreased by $11 million due to changes in deferred compensation plan liabilities. These decreases were partially offset by a $14 million
increase in payroll expense due to annual wage increases and a 53-week fiscal year in 2009 compared to 52 weeks in fiscal year 2008.
Amortization of Intangibles. Amortization of intangibles was relatively flat for fiscal year 2009 when compared to fiscal year 2008.
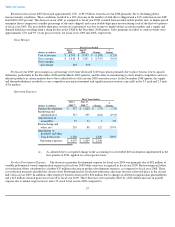
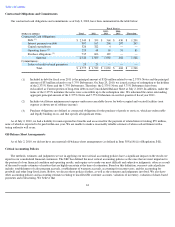
Restructuring and Other, net. During fiscal year 2009, we recorded restructuring and other charges of $210 million comprised mainly of
charges related to the restructuring plans announced in January and May 2009, both intended to realign our cost structure with the
macroeconomic business environment. These charges consisted of $173 million of employee termination benefits, $31 million related to lease
obligations associated with the site closures and $6 million of other exit costs. As of the dates we committed to these restructuring plans we
estimated annual savings upon completion of $130 million and $125 million from the January and May 2009 restructuring plans, respectively,
and $30 million, $42 million and $34 million from the Pittsburgh, Milpitas and Limavady site closures, respectively.
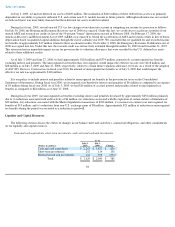
Impairment of Goodwill and Other Long-Lived Assets. During the December 2008 quarter, we determined that a significant adverse
change to our business climate had occurred, which required that we evaluate the carrying value of our goodwill and other long-lived assets,
principally intangible assets and property, equipment and leasehold improvements, for impairment. We made this determination as evidence of a
sustained and sharp deterioration in the general business environment, and specifically, all of our major markets, was building rapidly through
the quarter. Several of our customers and other technology companies in the supply chain of our customers, as well as our competitors, reduced
their financial outlook and/or otherwise disclosed that they were experiencing very challenging market conditions with little visibility of a
rebound. In addition, prior to the start of the December quarter, the TAM was estimated to be approximately 156 million units. At about eight
weeks into the quarter, the outlook for the TAM had decreased to be approximately 135 million units. After the close of the quarter, preliminary
industry data indicated actual shipments for the December quarter were approximately 123 million units. In response to these adverse business
indicators and the rapidly declining revenue trends experienced during our fiscal second quarter, we reduced our near-term and long-term
financial projections. Consequently, we performed an analysis of goodwill for impairment, and of the recoverability and impairment of other
long-
lived assets, in accordance with the guidance in Financial Accounting Standards Board's (FASB) Accounting Standards Codification (ASC)
Topic 350, Intangibles—Goodwill and Other (previously Statement of Financial Accounting Standards (SFAS) No. 142, Goodwill and Other
Intangible Assets
) and ASC 360, Property, Plant, and Equipment (previously SFAS No. 144, Accounting for the Impairment or Disposal of
Long
-Lived Assets
), respectively. Based on these analyses, we recorded impairment charges of $2.3 billion for goodwill and $3 million for other
long-lived assets. See Critical Accounting Policies herein for further details.
56