Seagate 2009 Annual Report Download - page 39
Download and view the complete annual report
Please find page 39 of the 2009 Seagate annual report below. You can navigate through the pages in the report by either clicking on the pages listed below, or by using the keyword search tool below to find specific information within the annual report.-
 1
1 -
2
-
3
-
4
-
5
-
6
-
7
-
8
-
9
-
10
-
11
-
12
-
13
-
14
-
15
-
16
-
17
-
18
-
19
-
20
-
21
-
22
-
23
-
24
-
25
-
26
-
27
-
28
-
 29
29 -
 30
30 -
 31
31 -
 32
32 -
 33
33 -
 34
34 -
 35
35 -
 36
36 -
 37
37 -
 38
38 -
 39
39 -
 40
40 -
 41
41 -
 42
42 -
 43
43 -
 44
44 -
 45
45 -
 46
46 -
 47
47 -
 48
48 -
 49
49 -
50
-
51
-
52
-
53
-
54
-
55
-
56
-
57
-
58
-
59
-
60
-
61
-
62
-
63
-
64
-
65
-
66
-
67
-
68
-
69
-
70
-
71
-
72
-
73
-
74
-
75
-
76
-
77
-
78
-
79
-
80
-
81
-
82
-
83
-
84
-
85
-
86
-
87
-
88
-
89
-
90
-
91
-
92
-
93
-
94
-
95
-
96
-
97
-
98
-
99
-
100
-
101
-
102
-
103
-
104
-
105
-
106
-
107
-
108
-
109
-
110
-
111
-
112
-
113
-
114
-
115
-
116
-
117
-
118
-
119
-
120
-
121
-
122
-
123
-
124
-
125
-
126
-
127
-
128
-
129
-
130
-
131
-
132
-
133
-
134
-
135
-
136
-
137
-
138
-
139
-
140
-
141
-
142
-
143
-
144
-
145
-
146
-
147
-
148
-
149
-
150
-
151
-
152
-
153
-
154
-
155
-
156
-
157
-
158
-
159
-
160
-
161
-
162
-
163
-
164
-
165
-
166
-
167
-
168
-
169
-
170
-
171
-
172
-
173
-
174
-
175
-
176
-
177
-
178
-
179
-
180
-
181
-
182
-
183
-
184
-
185
-
186
-
187
-
188
-
189
-
190
-
191
-
192
-
193
-
194
-
195
-
196
-
197
-
198
-
199
-
200
-
201
-
202
-
203
-
204
-
205
-
206
-
207
-
208
-
209
-
210
-
211
-
212
-
213
-
214
-
215
-
216
-
217
-
218
-
219
-
220
-
221
-
222
-
223
-
224
-
225
-
226
-
227
-
228
-
229
-
230
-
231
-
232
-
233
-
234
-
235
-
236
-
237
-
238
-
239
-
240
-
241
-
242
-
243
-
244
-
245
-
246
-
247
-
248
-
249
-
250
-
251
-
252
 |
 |

Table of Contents
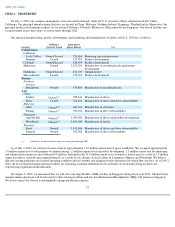
ITEM 2. PROPERTIES
On July 3, 2010, our company headquarters were relocated to Ireland, while our U.S. executive offices remained in Scotts Valley,
California. Our principal manufacturing facilities are located in China, Malaysia, Northern Ireland, Singapore, Thailand and in Minnesota. Our
principal product development facilities are located in California, Colorado, Minnesota, Massachusetts and Singapore. Our leased facilities are
occupied under leases that expire at various times through 2022.
Our material manufacturing, product development and marketing and administrative facilities at July 2, 2010 are as follows:
As of July 2, 2010, we owned or leased a total of approximately 11.9 million square feet of space worldwide. We occupied approximately
7.0 million square feet for the purpose of manufacturing, 1.3 million square feet for product development, 1.5 million square feet for marketing
and administrative purposes and subleased 0.8 million. Included in the 11.9 million square feet of owned or leased space is a total of 1.3 million
square feet that is currently unoccupied primarily as a result of site closures at our facilities in Longmont, Milpitas and Pittsburgh. We believe
that our existing properties are in good operating condition and are suitable and adequate for the operations for which they are used. As of July 2,
2010, all of our material manufacturing facilities are operating at normal utilization levels and none of our manufacturing facilities are
experiencing significant underutilization.
On August 4, 2009, we announced that we will close our Ang Mo Kio (AMK) facility in Singapore during fiscal year 2011. Our hard drive
manufacturing operations will be relocated to other existing facilities and our Asia International Headquarters (IHQ) will remain in Singapore.
We do not expect the closure to meaningfully change production capacity.
37
Location Building(s)
Owned or Leased Approximate
Square Footage Use
United States
California
Scotts Valley
Owned/Leased
251,866
Marketing and administrative
Fremont
Leased
157,925
Product development
Colorado
Owned/Leased
528,479
Product development
Minnesota
Owned
1,125,219
Manufacture of recording heads and product
development
Oklahoma
Owned/Leased
274,637
Administrative
Massachusetts
Leased
125,672
Product development
Europe
Northern
Ireland
Springtown
Owned
478,800
Manufacture of recording heads
Asia
China
Suzhou
Owned
(1)
958,341
Manufacture of drives
Wuxi
Leased
704,231
Manufacture of drives and drive subassemblies
Malaysia
Johor
Owned
(1)
630,500
Manufacture of substrates
Penang
Owned
(1)
390,254
Manufacture of drive subassemblies
Singapore
Ang Mo Kio
Owned
(1)
1,050,000
Manufacture of drives and product development
Woodlands
Owned
(1)
1,404,049
Manufacture of media
Thailand
Korat
Owned
1,162,846
Manufacture of drives and drive subassemblies
Teparuk
Owned
362,028
Manufacture of drive subassemblies
(1)
Land leases for these facilities expire at varying dates through 2067.