Seagate 2009 Annual Report Download - page 53
Download and view the complete annual report
Please find page 53 of the 2009 Seagate annual report below. You can navigate through the pages in the report by either clicking on the pages listed below, or by using the keyword search tool below to find specific information within the annual report.-
 1
1 -
2
-
3
-
4
-
5
-
6
-
7
-
8
-
9
-
10
-
11
-
12
-
13
-
14
-
15
-
16
-
17
-
18
-
19
-
20
-
21
-
22
-
23
-
24
-
25
-
26
-
27
-
28
-
29
-
30
-
31
-
32
-
33
-
34
-
35
-
36
-
37
-
38
-
39
-
40
-
41
-
42
-
 43
43 -
 44
44 -
 45
45 -
 46
46 -
 47
47 -
 48
48 -
 49
49 -
 50
50 -
 51
51 -
 52
52 -
 53
53 -
 54
54 -
 55
55 -
 56
56 -
 57
57 -
 58
58 -
 59
59 -
 60
60 -
 61
61 -
 62
62 -
 63
63 -
64
-
65
-
66
-
67
-
68
-
69
-
70
-
71
-
72
-
73
-
74
-
75
-
76
-
77
-
78
-
79
-
80
-
81
-
82
-
83
-
84
-
85
-
86
-
87
-
88
-
89
-
90
-
91
-
92
-
93
-
94
-
95
-
96
-
97
-
98
-
99
-
100
-
101
-
102
-
103
-
104
-
105
-
106
-
107
-
108
-
109
-
110
-
111
-
112
-
113
-
114
-
115
-
116
-
117
-
118
-
119
-
120
-
121
-
122
-
123
-
124
-
125
-
126
-
127
-
128
-
129
-
130
-
131
-
132
-
133
-
134
-
135
-
136
-
137
-
138
-
139
-
140
-
141
-
142
-
143
-
144
-
145
-
146
-
147
-
148
-
149
-
150
-
151
-
152
-
153
-
154
-
155
-
156
-
157
-
158
-
159
-
160
-
161
-
162
-
163
-
164
-
165
-
166
-
167
-
168
-
169
-
170
-
171
-
172
-
173
-
174
-
175
-
176
-
177
-
178
-
179
-
180
-
181
-
182
-
183
-
184
-
185
-
186
-
187
-
188
-
189
-
190
-
191
-
192
-
193
-
194
-
195
-
196
-
197
-
198
-
199
-
200
-
201
-
202
-
203
-
204
-
205
-
206
-
207
-
208
-
209
-
210
-
211
-
212
-
213
-
214
-
215
-
216
-
217
-
218
-
219
-
220
-
221
-
222
-
223
-
224
-
225
-
226
-
227
-
228
-
229
-
230
-
231
-
232
-
233
-
234
-
235
-
236
-
237
-
238
-
239
-
240
-
241
-
242
-
243
-
244
-
245
-
246
-
247
-
248
-
249
-
250
-
251
-
252
 |
 |

Table of Contents
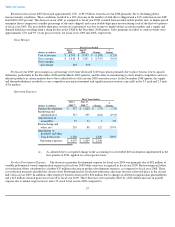
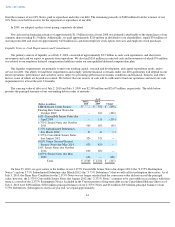
For fiscal year 2010, gross margin as a percentage of revenue increased to 28% from 14% in the prior fiscal year primarily as a result of an
18% increase in drive shipments, muted price erosion, a more cost-effective product mix and a substantial improvement in manufacturing
capacity utilization.
Operating Expenses
Product Development Expense. Product development expenses for fiscal year 2010 decreased approximately 8% from fiscal year 2009
primarily due to restructuring and other cost reduction efforts, and the effect of an additional week of compensation expenses in fiscal year 2009,
which was a 53-week fiscal year. These cost reduction efforts resulted in decreases of $66 million in headcount related expenses in fiscal year
2010, $38 million due to the cessation of certain product development activities, and $26 million due to the non-recurrence of accelerated
depreciation expense related to the closure of our Pittsburgh facility. These decreases were partially offset by increases of $48 million for
variable performance-based compensation expense recorded in fiscal year 2010 compared to none in fiscal year 2009, and a $16 million benefit
related to our deferred compensation plan recorded in fiscal year 2009.
Marketing and Administrative Expense. Marketing and administrative expenses for fiscal year 2010 decreased approximately 19% from
fiscal year 2009 primarily due to restructuring and other cost reduction efforts, and the effect of an additional week of compensation expenses in
fiscal year 2009, which was a 53-week fiscal year. These cost reduction efforts resulted in decreases of $69 million in headcount related
expenses, $26 million in advertising costs, and $29 million in legal expenses. These decreases were partially offset by increases of $28 million
for variable performance-based compensation expense recorded in fiscal year 2010 compared to none in fiscal year 2009, and a $9 million
benefit related to our deferred compensation plan recorded in fiscal year 2009.
Amortization of Intangibles. Amortization of intangibles for fiscal year 2010 decreased approximately 51% from fiscal year 2009 as
certain intangibles relating to the Maxtor Corporation ("Maxtor") and MetaLINCS, Inc. acquisitions have been fully amortized.
Restructuring and Other, net. During fiscal year 2010, we recorded restructuring and other charges of $66 million mainly comprised of
charges related to our AMK restructuring plan announced in August 2009 and additional restructuring charges related to our Pittsburgh facility
and facilities acquired as a part of the Maxtor acquisition.
Restructuring and Other, net decreased approximately $144 million when compared to the prior fiscal year, which include restructuring
plans announced in January and May 2009 that were intended to realign our cost structure with the fiscal year 2009 macroeconomic business
environment. See prior year explanation for further details.
51
Fiscal Years Ended
(Dollars in millions)
July 2,
2010
July 3,
2009
(1)
Change
%
Change
Product
development
$
877
$
953
$
(76
)
(8
)%
Marketing and
administrative
437
537
(100
)
(19
)%
Amortization of
intangibles
27
55
(28
)
(51
)%
Restructuring and
other, net
66
210
(144
)
(69
)%
Impairment of
goodwill and
other long-lived
assets, net of
recoveries
57
2,320
(2,263
)
(98
)%
Operating
expenses
$
1,464
$
4,075
$
(2,611
)
(1) As adjusted due to a required change in the accounting for convertible debt instruments implemented in the
first quarter of 2010, applied on a retrospective basis.