Seagate 2009 Annual Report Download - page 125
Download and view the complete annual report
Please find page 125 of the 2009 Seagate annual report below. You can navigate through the pages in the report by either clicking on the pages listed below, or by using the keyword search tool below to find specific information within the annual report.-
 1
1 -
2
-
3
-
4
-
5
-
6
-
7
-
8
-
9
-
10
-
11
-
12
-
13
-
14
-
15
-
16
-
17
-
18
-
19
-
20
-
21
-
22
-
23
-
24
-
25
-
26
-
27
-
28
-
29
-
30
-
31
-
32
-
33
-
34
-
35
-
36
-
37
-
38
-
39
-
40
-
41
-
42
-
43
-
44
-
45
-
46
-
47
-
48
-
49
-
50
-
51
-
52
-
53
-
54
-
55
-
56
-
57
-
58
-
59
-
60
-
61
-
62
-
63
-
64
-
65
-
66
-
67
-
68
-
69
-
70
-
71
-
72
-
73
-
74
-
75
-
76
-
77
-
78
-
79
-
80
-
81
-
82
-
83
-
84
-
85
-
86
-
87
-
88
-
89
-
90
-
91
-
92
-
93
-
94
-
95
-
96
-
97
-
98
-
99
-
100
-
101
-
102
-
103
-
104
-
105
-
106
-
107
-
108
-
109
-
110
-
111
-
112
-
113
-
114
-
 115
115 -
 116
116 -
 117
117 -
 118
118 -
 119
119 -
 120
120 -
 121
121 -
 122
122 -
 123
123 -
 124
124 -
 125
125 -
 126
126 -
 127
127 -
 128
128 -
 129
129 -
 130
130 -
 131
131 -
 132
132 -
 133
133 -
 134
134 -
 135
135 -
136
-
137
-
138
-
139
-
140
-
141
-
142
-
143
-
144
-
145
-
146
-
147
-
148
-
149
-
150
-
151
-
152
-
153
-
154
-
155
-
156
-
157
-
158
-
159
-
160
-
161
-
162
-
163
-
164
-
165
-
166
-
167
-
168
-
169
-
170
-
171
-
172
-
173
-
174
-
175
-
176
-
177
-
178
-
179
-
180
-
181
-
182
-
183
-
184
-
185
-
186
-
187
-
188
-
189
-
190
-
191
-
192
-
193
-
194
-
195
-
196
-
197
-
198
-
199
-
200
-
201
-
202
-
203
-
204
-
205
-
206
-
207
-
208
-
209
-
210
-
211
-
212
-
213
-
214
-
215
-
216
-
217
-
218
-
219
-
220
-
221
-
222
-
223
-
224
-
225
-
226
-
227
-
228
-
229
-
230
-
231
-
232
-
233
-
234
-
235
-
236
-
237
-
238
-
239
-
240
-
241
-
242
-
243
-
244
-
245
-
246
-
247
-
248
-
249
-
250
-
251
-
252
 |
 |

Table of Contents
SEAGATE TECHNOLOGY
NOTES TO CONSOLIDATED FINANCIAL STATEMENTS—(Continued)
16. Related Party Transactions
During fiscal year 2010, members of the Company's board of directors also served on the boards of the following companies with which the
Company had transactions:
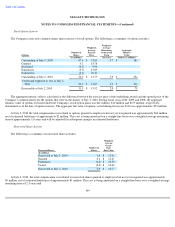
Microsoft Corporation ("Microsoft"). During fiscal years 2010 and 2008, the Company recorded revenue of $94 million and $5 million
from sales to Microsoft, respectively. During fiscal year 2009, the Company's sales to Microsoft were immaterial. The Company's purchases
from Microsoft for fiscal years 2010, 2009 and 2008 were immaterial. At July 2, 2010 and July 3, 2009, the Company's accounts receivable and
accounts payable related to Microsoft were immaterial.
United Parcel Service, Inc. ("UPS") The Company made payments for freight and logistics services to UPS of $120 million, $167 million
and $207 million in fiscal years 2010, 2009 and 2008, respectively. At July 2, 2010 and July 3, 2009, the Company had accounts payable to UPS
of $21 million and $18 million, respectively.
LSI Corporation ("LSI") The Company recorded revenue of $63 million, $38 million and $48 million from sales to LSI for fiscal years
2010, 2009 and 2008, respectively. The Company had accounts receivable of $6 million and $6 million from LSI at July 2, 2010 and July 3,
2009, respectively. The Company made payments to LSI in fiscal years 2010, 2009 and 2008 of $320 million, $153 million and $208 million,
respectively, related to purchases of various components. The Company had accounts payable to LSI of $48 million and $55 million at July 2,
2010 and July 3, 2009, respectively.
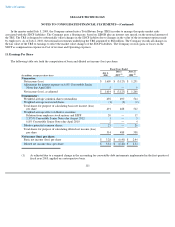
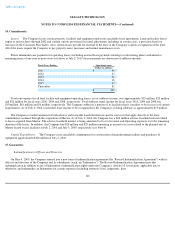
17. Supplementary Financial Data (Unaudited)
Quarterly Data
The Company operated and reported financial results based on 13-week quarters in fiscal year 2010, which ended on the Friday closest to
September 30, December 31, March 31, and June 30.
The Company operated and reported financial results based on a 14-
week quarter in its first quarter of fiscal year 2009 ending on the Friday
closest to September 30, 2008 and 13-week quarters which ended
118
Fiscal Year 2010 Quarters Ended
(In millions, except per share data)
October 2,
2009 January 1,
2010 April 2,
2010 July 2,
2010
Revenue
$
2,663
$
3,027
$
3,049
$
2,656
Gross margin
653
923
901
728
Income (loss) from operations
221
578
560
380
Net income (loss)
179
533
518
379
Net income (loss) per share:
Basic
$
0.36
$
1.07
$
1.05
$
0.79
Diluted
0.35
1.03
1.00
0.76