Seagate 2009 Annual Report Download - page 115
Download and view the complete annual report
Please find page 115 of the 2009 Seagate annual report below. You can navigate through the pages in the report by either clicking on the pages listed below, or by using the keyword search tool below to find specific information within the annual report.-
 1
1 -
2
-
3
-
4
-
5
-
6
-
7
-
8
-
9
-
10
-
11
-
12
-
13
-
14
-
15
-
16
-
17
-
18
-
19
-
20
-
21
-
22
-
23
-
24
-
25
-
26
-
27
-
28
-
29
-
30
-
31
-
32
-
33
-
34
-
35
-
36
-
37
-
38
-
39
-
40
-
41
-
42
-
43
-
44
-
45
-
46
-
47
-
48
-
49
-
50
-
51
-
52
-
53
-
54
-
55
-
56
-
57
-
58
-
59
-
60
-
61
-
62
-
63
-
64
-
65
-
66
-
67
-
68
-
69
-
70
-
71
-
72
-
73
-
74
-
75
-
76
-
77
-
78
-
79
-
80
-
81
-
82
-
83
-
84
-
85
-
86
-
87
-
88
-
89
-
90
-
91
-
92
-
93
-
94
-
95
-
96
-
97
-
98
-
99
-
100
-
101
-
102
-
103
-
104
-
 105
105 -
 106
106 -
 107
107 -
 108
108 -
 109
109 -
 110
110 -
 111
111 -
 112
112 -
 113
113 -
 114
114 -
 115
115 -
 116
116 -
 117
117 -
 118
118 -
 119
119 -
 120
120 -
 121
121 -
 122
122 -
 123
123 -
 124
124 -
 125
125 -
126
-
127
-
128
-
129
-
130
-
131
-
132
-
133
-
134
-
135
-
136
-
137
-
138
-
139
-
140
-
141
-
142
-
143
-
144
-
145
-
146
-
147
-
148
-
149
-
150
-
151
-
152
-
153
-
154
-
155
-
156
-
157
-
158
-
159
-
160
-
161
-
162
-
163
-
164
-
165
-
166
-
167
-
168
-
169
-
170
-
171
-
172
-
173
-
174
-
175
-
176
-
177
-
178
-
179
-
180
-
181
-
182
-
183
-
184
-
185
-
186
-
187
-
188
-
189
-
190
-
191
-
192
-
193
-
194
-
195
-
196
-
197
-
198
-
199
-
200
-
201
-
202
-
203
-
204
-
205
-
206
-
207
-
208
-
209
-
210
-
211
-
212
-
213
-
214
-
215
-
216
-
217
-
218
-
219
-
220
-
221
-
222
-
223
-
224
-
225
-
226
-
227
-
228
-
229
-
230
-
231
-
232
-
233
-
234
-
235
-
236
-
237
-
238
-
239
-
240
-
241
-
242
-
243
-
244
-
245
-
246
-
247
-
248
-
249
-
250
-
251
-
252
 |
 |

Table of Contents
SEAGATE TECHNOLOGY
NOTES TO CONSOLIDATED FINANCIAL STATEMENTS—(Continued)
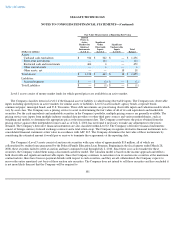
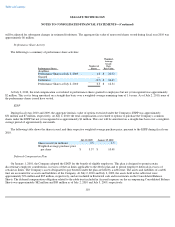
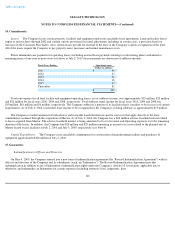
Fair Value —The fair value of the Company's nonvested shares and performance shares is the price of the Company's shares on the grant
date. The fair value of the Company's shares related to options granted to employees and shares issued from the ESPP for fiscal years 2010, 2009
and 2008 were estimated using the following weighted-average assumptions:
Stock Compensation Expense
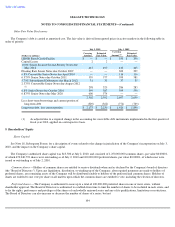
Stock Compensation Expense —The Company recorded $57 million, $83 million and $113 million of stock-based compensation during
fiscal years 2010, 2009 and 2008, respectively. Management has made an estimate of expected forfeitures and is recognizing compensation costs
only for those equity awards expected to vest. When estimating forfeitures, the Company considers voluntary termination behavior as well as
analysis of actual forfeited awards.
Cash Flows from Excess Tax Benefits —The cash flows resulting from excess tax benefits (tax benefits related to the excess of proceeds
from employee's exercises of stock options over the stock-based compensation cost recognized for those options) are classified as financing cash
flows. The Company did not recognize any cash flows from excess tax benefits during fiscal years 2010 and 2009. The Company recorded
approximately $6 million of excess tax benefits as a financing cash inflow during fiscal year 2008.
108
Fiscal Years Ended
2010
2009
2008
Nonvested Shares
Weighted
-
average fair
value
$15.47
$13.09
$22.24
Performance Shares
Weighted-average fair
value
n/a
$12.38
$26.47
Options
Expected term (in years)
4.2
4.0
–
4.5
4.0
Volatility
51
–
57%
36
–
50%
35
–
36%
Expected dividend rate
0%
0
–
12.2%
1.5
–
2.5%
Risk
-
free interest rate
1.7
–
2.1%
1.6
–
3.0%
2.3
–
4.2%
Weighted
-
average fair
value
$6.45
$1.47
$7.31
ESPP
Expected term (in years)
0.5
0.5
0.5
Volatility
49
–
60%
39
–
84%
31
–
36%
Expected dividend rate
0%
3.0
–
3.2%
1.7
–
2.3%
Risk
-
free interest rate
0.2
–
0.3%
0.4
–
2.0%
2.0
–
5.0%
Weighted-average fair
value
$4.19
$2.48
$4.67