Seagate 2009 Annual Report Download - page 118
Download and view the complete annual report
Please find page 118 of the 2009 Seagate annual report below. You can navigate through the pages in the report by either clicking on the pages listed below, or by using the keyword search tool below to find specific information within the annual report.-
 1
1 -
2
-
3
-
4
-
5
-
6
-
7
-
8
-
9
-
10
-
11
-
12
-
13
-
14
-
15
-
16
-
17
-
18
-
19
-
20
-
21
-
22
-
23
-
24
-
25
-
26
-
27
-
28
-
29
-
30
-
31
-
32
-
33
-
34
-
35
-
36
-
37
-
38
-
39
-
40
-
41
-
42
-
43
-
44
-
45
-
46
-
47
-
48
-
49
-
50
-
51
-
52
-
53
-
54
-
55
-
56
-
57
-
58
-
59
-
60
-
61
-
62
-
63
-
64
-
65
-
66
-
67
-
68
-
69
-
70
-
71
-
72
-
73
-
74
-
75
-
76
-
77
-
78
-
79
-
80
-
81
-
82
-
83
-
84
-
85
-
86
-
87
-
88
-
89
-
90
-
91
-
92
-
93
-
94
-
95
-
96
-
97
-
98
-
99
-
100
-
101
-
102
-
103
-
104
-
105
-
106
-
107
-
 108
108 -
 109
109 -
 110
110 -
 111
111 -
 112
112 -
 113
113 -
 114
114 -
 115
115 -
 116
116 -
 117
117 -
 118
118 -
 119
119 -
 120
120 -
 121
121 -
 122
122 -
 123
123 -
 124
124 -
 125
125 -
 126
126 -
 127
127 -
 128
128 -
129
-
130
-
131
-
132
-
133
-
134
-
135
-
136
-
137
-
138
-
139
-
140
-
141
-
142
-
143
-
144
-
145
-
146
-
147
-
148
-
149
-
150
-
151
-
152
-
153
-
154
-
155
-
156
-
157
-
158
-
159
-
160
-
161
-
162
-
163
-
164
-
165
-
166
-
167
-
168
-
169
-
170
-
171
-
172
-
173
-
174
-
175
-
176
-
177
-
178
-
179
-
180
-
181
-
182
-
183
-
184
-
185
-
186
-
187
-
188
-
189
-
190
-
191
-
192
-
193
-
194
-
195
-
196
-
197
-
198
-
199
-
200
-
201
-
202
-
203
-
204
-
205
-
206
-
207
-
208
-
209
-
210
-
211
-
212
-
213
-
214
-
215
-
216
-
217
-
218
-
219
-
220
-
221
-
222
-
223
-
224
-
225
-
226
-
227
-
228
-
229
-
230
-
231
-
232
-
233
-
234
-
235
-
236
-
237
-
238
-
239
-
240
-
241
-
242
-
243
-
244
-
245
-
246
-
247
-
248
-
249
-
250
-
251
-
252
 |
 |

Table of Contents
SEAGATE TECHNOLOGY
NOTES TO CONSOLIDATED FINANCIAL STATEMENTS—(Continued)
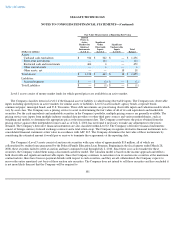
In the quarter ended July 3, 2009, the Company entered into a Total Return Swap (TRS) in order to manage the equity market risks
associated with the SDCP liabilities. The Company pays a floating rate, based on LIBOR plus an interest rate spread, on the notional amount of
the TRS. The TRS is designed to substantially offset changes in the SDCP liability due to changes in the value of the investment options made
by employees. As of July 2, 2010, the notional investments underlying the TRS amounted to $68 million. The Company records all changes in
the fair value of the TRS to earnings to offset the market value changes of the SDCP liabilities. The Company records gains or losses on the
SDCP as compensation expense in Cost of revenue and Operating expenses.
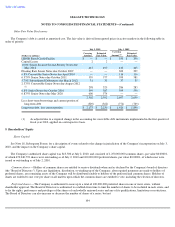
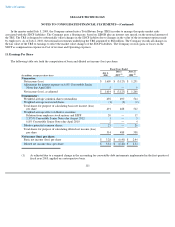
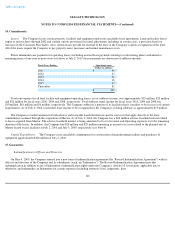
11. Earnings Per Share
The following table sets forth the computation of basic and diluted net income (loss) per share:
111
Fiscal Years Ended
(In millions, except per share data)
July 2,
2010
July 3,
2009
(1)
June 27,
2008
(1)
Numerator:
Net income (loss)
$
1,609
$
(3,125
)
$
1,251
Adjustment for interest expense on 6.8% Convertible Senior
Notes due April 2010
5
—
9
Net income (loss), as adjusted
$
1,614
$
(3,125
)
$
1,260
Denominator:
Weighted
-
average common shares outstanding
492
490
514
Weighted
-
average nonvested shares
(1
)
(2
)
(2
)
Total shares for purpose of calculating basic net income (loss)
per share
491
488
512
Weighted
-
average effect of dilutive securities:
Dilution from employee stock options and ESPP
20
—
17
2.375% Convertible Senior Notes due August 2012
1
—
5
6.8% Convertible Senior Notes due April 2010
2
—
4
Dilutive potential common shares:
23
—
26
Total shares for purpose of calculating diluted net income (loss)
per share
514
488
538
Net income (loss) per share:
Basic net income (loss) per share
$
3.28
$
(6.40
)
$
2.44
Diluted net income (loss) per share
$
3.14
$
(6.40
)
$
2.34
(1) As adjusted due to a required change in the accounting for convertible debt instruments implemented in the first quarter of
fiscal year 2010, applied on a retrospective basis.