Seagate 2009 Annual Report Download - page 51
Download and view the complete annual report
Please find page 51 of the 2009 Seagate annual report below. You can navigate through the pages in the report by either clicking on the pages listed below, or by using the keyword search tool below to find specific information within the annual report.-
 1
1 -
2
-
3
-
4
-
5
-
6
-
7
-
8
-
9
-
10
-
11
-
12
-
13
-
14
-
15
-
16
-
17
-
18
-
19
-
20
-
21
-
22
-
23
-
24
-
25
-
26
-
27
-
28
-
29
-
30
-
31
-
32
-
33
-
34
-
35
-
36
-
37
-
38
-
39
-
40
-
 41
41 -
 42
42 -
 43
43 -
 44
44 -
 45
45 -
 46
46 -
 47
47 -
 48
48 -
 49
49 -
 50
50 -
 51
51 -
 52
52 -
 53
53 -
 54
54 -
 55
55 -
 56
56 -
 57
57 -
 58
58 -
 59
59 -
 60
60 -
 61
61 -
62
-
63
-
64
-
65
-
66
-
67
-
68
-
69
-
70
-
71
-
72
-
73
-
74
-
75
-
76
-
77
-
78
-
79
-
80
-
81
-
82
-
83
-
84
-
85
-
86
-
87
-
88
-
89
-
90
-
91
-
92
-
93
-
94
-
95
-
96
-
97
-
98
-
99
-
100
-
101
-
102
-
103
-
104
-
105
-
106
-
107
-
108
-
109
-
110
-
111
-
112
-
113
-
114
-
115
-
116
-
117
-
118
-
119
-
120
-
121
-
122
-
123
-
124
-
125
-
126
-
127
-
128
-
129
-
130
-
131
-
132
-
133
-
134
-
135
-
136
-
137
-
138
-
139
-
140
-
141
-
142
-
143
-
144
-
145
-
146
-
147
-
148
-
149
-
150
-
151
-
152
-
153
-
154
-
155
-
156
-
157
-
158
-
159
-
160
-
161
-
162
-
163
-
164
-
165
-
166
-
167
-
168
-
169
-
170
-
171
-
172
-
173
-
174
-
175
-
176
-
177
-
178
-
179
-
180
-
181
-
182
-
183
-
184
-
185
-
186
-
187
-
188
-
189
-
190
-
191
-
192
-
193
-
194
-
195
-
196
-
197
-
198
-
199
-
200
-
201
-
202
-
203
-
204
-
205
-
206
-
207
-
208
-
209
-
210
-
211
-
212
-
213
-
214
-
215
-
216
-
217
-
218
-
219
-
220
-
221
-
222
-
223
-
224
-
225
-
226
-
227
-
228
-
229
-
230
-
231
-
232
-
233
-
234
-
235
-
236
-
237
-
238
-
239
-
240
-
241
-
242
-
243
-
244
-
245
-
246
-
247
-
248
-
249
-
250
-
251
-
252
 |
 |

Table of Contents
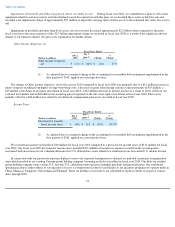
Results of Operations
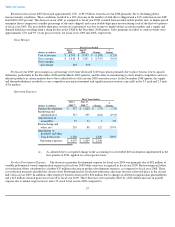
The following table summarizes information from our consolidated statements of operations by dollars and as a percentage of revenue:
49
Fiscal Years Ended
(Dollars in millions)
July 2,
2010
July 3,
2009
(1)
June 27,
2008
(1)
Revenue
$
11,395
$
9,805
$
12,708
Cost of revenue
8,191
8,395
9,503
Gross margin
3,204
1,410
3,205
Product development
877
953
1,028
Marketing and administrative
437
537
659
Amortization of intangibles
27
55
54
Restructuring and other, net
66
210
88
Impairment of goodwill and
other long-lived assets, net
of recoveries
57
2,320
—
Income (loss) from operations
1,740
(2,665
)
1,376
Other income (expense), net
(171
)
(149
)
(58
)
Income (loss) before income
taxes
1,569
(2,814
)
1,318
Provision for (benefit from)
income taxes
(40
)
311
67
Net income (loss)
$
1,609
$
(3,125
)
$
1,251
(1) As adjusted due to a required change in the accounting for convertible debt instruments implemented in the
first quarter of 2010, applied on a retrospective basis.
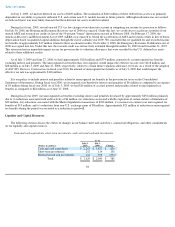
Fiscal Years Ended
(as a percentage of Revenue)
July 2,
2010
July 3,
2009
(1)
June 27,
2008
(1)
Revenue
100
%
100
%
100
%
Cost of revenue
72
86
75
Gross margin
28
14
25
Product development
8
10
8
Marketing and administrative
4
5
5
Amortization of intangibles
—
1
—
Restructuring and other, net
1
2
1
Impairment of goodwill and other
long-lived assets, net of
recoveries
—
24
—
Income (loss) from operations
15
(28
)
11
Other income (expense), net
(1
)
(1
)
—
Income (loss) before income taxes
14
(29
)
11
Provision for (benefit from)
income taxes
—
3
1
Net income (loss)
14
%
(32
)%
10
%
(1) As adjusted due to a required change in the accounting for convertible debt instruments implemented in the
first quarter of 2010, applied on a retrospective basis.