Seagate 2009 Annual Report Download - page 60
Download and view the complete annual report
Please find page 60 of the 2009 Seagate annual report below. You can navigate through the pages in the report by either clicking on the pages listed below, or by using the keyword search tool below to find specific information within the annual report.-
 1
1 -
2
-
3
-
4
-
5
-
6
-
7
-
8
-
9
-
10
-
11
-
12
-
13
-
14
-
15
-
16
-
17
-
18
-
19
-
20
-
21
-
22
-
23
-
24
-
25
-
26
-
27
-
28
-
29
-
30
-
31
-
32
-
33
-
34
-
35
-
36
-
37
-
38
-
39
-
40
-
41
-
42
-
43
-
44
-
45
-
46
-
47
-
48
-
49
-
 50
50 -
 51
51 -
 52
52 -
 53
53 -
 54
54 -
 55
55 -
 56
56 -
 57
57 -
 58
58 -
 59
59 -
 60
60 -
 61
61 -
 62
62 -
 63
63 -
 64
64 -
 65
65 -
 66
66 -
 67
67 -
 68
68 -
 69
69 -
 70
70 -
71
-
72
-
73
-
74
-
75
-
76
-
77
-
78
-
79
-
80
-
81
-
82
-
83
-
84
-
85
-
86
-
87
-
88
-
89
-
90
-
91
-
92
-
93
-
94
-
95
-
96
-
97
-
98
-
99
-
100
-
101
-
102
-
103
-
104
-
105
-
106
-
107
-
108
-
109
-
110
-
111
-
112
-
113
-
114
-
115
-
116
-
117
-
118
-
119
-
120
-
121
-
122
-
123
-
124
-
125
-
126
-
127
-
128
-
129
-
130
-
131
-
132
-
133
-
134
-
135
-
136
-
137
-
138
-
139
-
140
-
141
-
142
-
143
-
144
-
145
-
146
-
147
-
148
-
149
-
150
-
151
-
152
-
153
-
154
-
155
-
156
-
157
-
158
-
159
-
160
-
161
-
162
-
163
-
164
-
165
-
166
-
167
-
168
-
169
-
170
-
171
-
172
-
173
-
174
-
175
-
176
-
177
-
178
-
179
-
180
-
181
-
182
-
183
-
184
-
185
-
186
-
187
-
188
-
189
-
190
-
191
-
192
-
193
-
194
-
195
-
196
-
197
-
198
-
199
-
200
-
201
-
202
-
203
-
204
-
205
-
206
-
207
-
208
-
209
-
210
-
211
-
212
-
213
-
214
-
215
-
216
-
217
-
218
-
219
-
220
-
221
-
222
-
223
-
224
-
225
-
226
-
227
-
228
-
229
-
230
-
231
-
232
-
233
-
234
-
235
-
236
-
237
-
238
-
239
-
240
-
241
-
242
-
243
-
244
-
245
-
246
-
247
-
248
-
249
-
250
-
251
-
252
 |
 |

Table of Contents
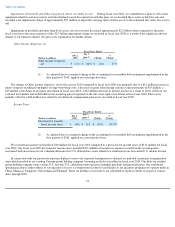
At July 3, 2009, we had net deferred tax assets of $469 million. The realization of $416 million of these deferred tax assets was primarily
dependent on our ability to generate sufficient U.S. and certain non-U.S. taxable income in future periods. Although realization was not assured,
we believed that it was more likely than not that these deferred tax assets would be realized.
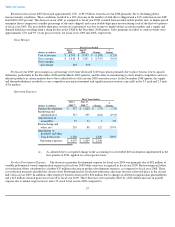
During fiscal year, 2009, several enacted U.S. tax law changes were taken into account in computing our income tax provision as follows.
On July 30, 2008, the Housing and Economic Recovery Act of 2008 was enacted. Under this law, we could elect to accelerate a portion of our
unused AMT and research tax credits in lieu of the 50-percent "bonus" depreciation enacted in February 2008. On February 17, 2009, the
American Recovery and Reinvestment Act of 2009 (ARRA) was enacted to extend the acceleration of AMT and research credits in lieu of bonus
depreciation based on qualified capital additions through the end of calendar year 2009. We concluded that we qualified for and recorded income
tax benefits of approximately $17 million related to these accelerated credits. On October 3, 2008, the Emergency Economic Stabilization Act of
2008 was signed into law. Under this law, the research credit was retroactively extended through December 31, 2009 from December 31, 2007.
This extension had no immediate impact on our tax provision due to valuation allowances that were recorded for the U.S. deferred tax assets
related to these additional credits.
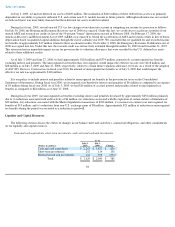
As of July 3, 2009 and June 27, 2008, we had approximately $118 million and $374 million, respectively, in unrecognized tax benefits
excluding interest and penalties. The unrecognized tax benefits that, if recognized, would impact the effective tax rate were $118 million and
$68 million as of July 3, 2009 and June 27, 2008, respectively, subject to certain future valuation allowance reversals. As a result of the adoption
of ASC 805, Business Combinations in fiscal year 2010, the amount of unrecognized tax benefits as of July 3, 2009 that would impact the
effective tax rate was approximately $118 million.
It is our policy to include interest and penalties related to unrecognized tax benefits in the provision for taxes on the Consolidated
Statements of Operations. During fiscal year 2009, we recognized a net benefit for interest and penalties of $6 million as compared to an expense
of $3 million during fiscal year 2008. As of July 3, 2009, we had $16 million of accrued interest and penalties related to unrecognized tax
benefits as compared to $22 million as of June 27, 2008.
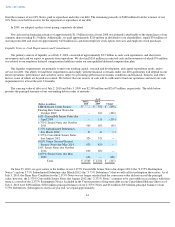
During fiscal year 2009, our unrecognized tax benefits excluding interest and penalties decreased by approximately $256 million primarily
due to (i) reductions associated with audit activity of $6 million, (ii) reductions associated with the expiration of certain statutes of limitation of
$23 million, (iii) reductions associated with the Maxtor liquidation transactions of $232 million, (iv) increases in current year unrecognized tax
benefits of $13 million, and (v) reductions from non-
U.S. exchange gains of $8 million. Approximately $21 million of reduction in unrecognized
tax benefits during the period was recorded as a reduction to goodwill.
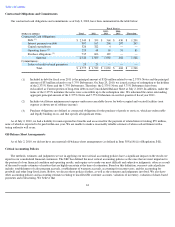
Liquidity and Capital Resources
The following sections discuss the effects of changes in our balance sheet and cash flows, contractual obligations, and other commitments
on our liquidity and capital resources.
Cash and cash equivalents, short-term investments, and restricted cash and investments
58
As of
(Dollars in millions)
July 2,
2010
July 3,
2009
Change
Cash and cash equivalents
$
2,263
$
1,427
$
836
Short
-
term investments
252
114
138
Restricted cash and investments
114
508
(394
)
Total
$
2,629
$
2,049
$
580