Seagate 2009 Annual Report Download - page 62
Download and view the complete annual report
Please find page 62 of the 2009 Seagate annual report below. You can navigate through the pages in the report by either clicking on the pages listed below, or by using the keyword search tool below to find specific information within the annual report.-
 1
1 -
2
-
3
-
4
-
5
-
6
-
7
-
8
-
9
-
10
-
11
-
12
-
13
-
14
-
15
-
16
-
17
-
18
-
19
-
20
-
21
-
22
-
23
-
24
-
25
-
26
-
27
-
28
-
29
-
30
-
31
-
32
-
33
-
34
-
35
-
36
-
37
-
38
-
39
-
40
-
41
-
42
-
43
-
44
-
45
-
46
-
47
-
48
-
49
-
50
-
51
-
 52
52 -
 53
53 -
 54
54 -
 55
55 -
 56
56 -
 57
57 -
 58
58 -
 59
59 -
 60
60 -
 61
61 -
 62
62 -
 63
63 -
 64
64 -
 65
65 -
 66
66 -
 67
67 -
 68
68 -
 69
69 -
 70
70 -
 71
71 -
 72
72 -
73
-
74
-
75
-
76
-
77
-
78
-
79
-
80
-
81
-
82
-
83
-
84
-
85
-
86
-
87
-
88
-
89
-
90
-
91
-
92
-
93
-
94
-
95
-
96
-
97
-
98
-
99
-
100
-
101
-
102
-
103
-
104
-
105
-
106
-
107
-
108
-
109
-
110
-
111
-
112
-
113
-
114
-
115
-
116
-
117
-
118
-
119
-
120
-
121
-
122
-
123
-
124
-
125
-
126
-
127
-
128
-
129
-
130
-
131
-
132
-
133
-
134
-
135
-
136
-
137
-
138
-
139
-
140
-
141
-
142
-
143
-
144
-
145
-
146
-
147
-
148
-
149
-
150
-
151
-
152
-
153
-
154
-
155
-
156
-
157
-
158
-
159
-
160
-
161
-
162
-
163
-
164
-
165
-
166
-
167
-
168
-
169
-
170
-
171
-
172
-
173
-
174
-
175
-
176
-
177
-
178
-
179
-
180
-
181
-
182
-
183
-
184
-
185
-
186
-
187
-
188
-
189
-
190
-
191
-
192
-
193
-
194
-
195
-
196
-
197
-
198
-
199
-
200
-
201
-
202
-
203
-
204
-
205
-
206
-
207
-
208
-
209
-
210
-
211
-
212
-
213
-
214
-
215
-
216
-
217
-
218
-
219
-
220
-
221
-
222
-
223
-
224
-
225
-
226
-
227
-
228
-
229
-
230
-
231
-
232
-
233
-
234
-
235
-
236
-
237
-
238
-
239
-
240
-
241
-
242
-
243
-
244
-
245
-
246
-
247
-
248
-
249
-
250
-
251
-
252
 |
 |

Table of Contents
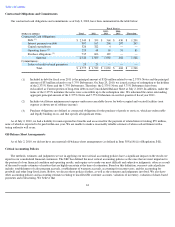
compensation, impairment of goodwill and other long-lived assets and the income tax provision related to a change in our valuation allowance
for deferred tax assets, and:
• a decrease of $372 million in accounts receivable due to a decrease in revenue, improved sales linearity and a shift in channel
mix;
•
a decrease of $358 million in inventories due to improved inventory and build schedule management and supply chain
improvements; and
• a decrease of $296 million in accrued employee compensation primarily due to no variable performance-based compensation
expense in fiscal year 2009.
Cash provided by operating activities for fiscal year 2008 was approximately $2.5 billion and includes the effects of our net income
adjusted for non-cash items including depreciation, amortization, and stock-based compensation, and:
•
an increase of $351 million in accounts payable, primarily as a result of outsourcing the manufacture of certain sub
-
assemblies to
third parties;
• an increase of $238 million in vendor non-trade receivables, primarily as a result of outsourcing the manufacture of certain sub-
assemblies to third parties (see Item 8. Note 2. Balance Sheet Information);
•
an increase of $151 million in inventories, principally raw materials and finished goods; and
• an increase of $288 million in accrued expenses and employee compensation.
Cash Used in Investing Activities
In fiscal year 2010, we used $752 million for net cash investing activities, which was primarily attributable to payments for property,
equipment and leasehold improvements of approximately $639 million.
In fiscal year 2009, we used $618 million for net cash investing activities, which was primarily attributable to payments for property,
equipment and leasehold improvements of approximately $633 million.
In fiscal year 2008, we used $991 million for net cash investing activities, which was primarily attributable to expenditures for property,
equipment and leasehold improvements of approximately $930 million and $74 million for the acquisition of MetaLINCS.
Cash Provided by (Used in) Financing Activities
Net cash used in financing activities of $344 million for fiscal year 2010 was primarily attributable to the repayment of $350 million of our
amended credit facility, the repayment of our $300 million in aggregate principal amount of Floating Rate Senior Notes due October 2009,
approximately $80 million of open market purchases of our 6.8% Notes and 2011 Notes. The repayment and repurchase of the Floating Rate
Senior Notes and the open market purchases were paid with approximately $379 million of restricted cash, previously held in escrow. We also
paid $77 million in aggregate principal amount of our 6.8% Notes, and approximately $584 million to repurchase 32.4 million of our common
shares, which was partially offset by $587 million in net proceeds from the issuance of our 2020 Notes and $86 million in proceeds from the
exercise of stock options and employee stock purchases.
Net cash provided by financing activities for fiscal year 2009 was primarily attributable to $399 million in net proceeds from the issuance of
our 10% Senior Secured Second-Priority Notes due May 2014 (the "10% Notes") and $350 million drawn on our credit facility. Cash proceeds
from financing activities were offset by $132 million in dividends paid to our shareholders and $55 million, including $19 million proceeds
60