Seagate 2009 Annual Report Download - page 57
Download and view the complete annual report
Please find page 57 of the 2009 Seagate annual report below. You can navigate through the pages in the report by either clicking on the pages listed below, or by using the keyword search tool below to find specific information within the annual report.-
 1
1 -
2
-
3
-
4
-
5
-
6
-
7
-
8
-
9
-
10
-
11
-
12
-
13
-
14
-
15
-
16
-
17
-
18
-
19
-
20
-
21
-
22
-
23
-
24
-
25
-
26
-
27
-
28
-
29
-
30
-
31
-
32
-
33
-
34
-
35
-
36
-
37
-
38
-
39
-
40
-
41
-
42
-
43
-
44
-
45
-
46
-
 47
47 -
 48
48 -
 49
49 -
 50
50 -
 51
51 -
 52
52 -
 53
53 -
 54
54 -
 55
55 -
 56
56 -
 57
57 -
 58
58 -
 59
59 -
 60
60 -
 61
61 -
 62
62 -
 63
63 -
 64
64 -
 65
65 -
 66
66 -
 67
67 -
68
-
69
-
70
-
71
-
72
-
73
-
74
-
75
-
76
-
77
-
78
-
79
-
80
-
81
-
82
-
83
-
84
-
85
-
86
-
87
-
88
-
89
-
90
-
91
-
92
-
93
-
94
-
95
-
96
-
97
-
98
-
99
-
100
-
101
-
102
-
103
-
104
-
105
-
106
-
107
-
108
-
109
-
110
-
111
-
112
-
113
-
114
-
115
-
116
-
117
-
118
-
119
-
120
-
121
-
122
-
123
-
124
-
125
-
126
-
127
-
128
-
129
-
130
-
131
-
132
-
133
-
134
-
135
-
136
-
137
-
138
-
139
-
140
-
141
-
142
-
143
-
144
-
145
-
146
-
147
-
148
-
149
-
150
-
151
-
152
-
153
-
154
-
155
-
156
-
157
-
158
-
159
-
160
-
161
-
162
-
163
-
164
-
165
-
166
-
167
-
168
-
169
-
170
-
171
-
172
-
173
-
174
-
175
-
176
-
177
-
178
-
179
-
180
-
181
-
182
-
183
-
184
-
185
-
186
-
187
-
188
-
189
-
190
-
191
-
192
-
193
-
194
-
195
-
196
-
197
-
198
-
199
-
200
-
201
-
202
-
203
-
204
-
205
-
206
-
207
-
208
-
209
-
210
-
211
-
212
-
213
-
214
-
215
-
216
-
217
-
218
-
219
-
220
-
221
-
222
-
223
-
224
-
225
-
226
-
227
-
228
-
229
-
230
-
231
-
232
-
233
-
234
-
235
-
236
-
237
-
238
-
239
-
240
-
241
-
242
-
243
-
244
-
245
-
246
-
247
-
248
-
249
-
250
-
251
-
252
 |
 |

Table of Contents
Revenue in fiscal year 2009 decreased approximately 23%, or $2.9 billion, from fiscal year 2008 primarily due to declining global
macroeconomic conditions. These conditions resulted in a 10% decrease in the number of disk drives shipped and a 13% reduction in our ASP
from $68 to $59 per unit. The decrease in our ASP, as compared to fiscal year 2008, resulted from an unfavorable product mix, as higher-priced
enterprise drives comprised a smaller percentage of the units shipped, and a near double-digit price erosion during each of the first two quarters
of fiscal year 2009. The near double-digit price erosion we experienced was due to time-to-market delays in certain markets and a supply and
demand imbalance resulting from a sharp decline in the TAM in the December 2008 quarter. Sales programs recorded as contra revenue were
approximately 12% and 9% of our gross revenue, for fiscal years 2009 and 2008, respectively.
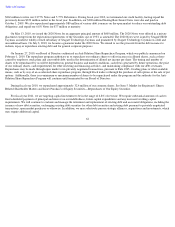
Gross Margin
For fiscal year 2009, gross margin as a percentage of revenue decreased 1100 basis points primarily due to price erosion, lower capacity
utilization, particularly in the December 2008 and the March 2009 quarters, and the delay in transitioning to more market-competitive and cost-
efficient products in certain markets due to the residual effects of fiscal year 2008 execution issues. In the December 2008 quarter, the supply
and demand imbalance resulted in a very competitive pricing environment and significant price erosion, especially in the 3.5-inch and 2.5-inch
ATA markets.
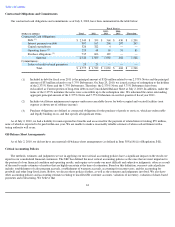
Operating Expenses
Product Development Expense. The decrease in product development expense for fiscal year 2009 was primarily due to $82 million of
variable performance-based compensation expense in fiscal year 2008 while none was recognized in fiscal year 2009. Restructuring and other
cost reduction efforts contributed to a further $35 million reduction in product development expenses, as compared to fiscal year 2008. These
cost reduction measures included the closure of the Pittsburgh facility, headcount reductions and wage decreases that took place in the second
half of fiscal year 2009. In addition, other employee benefits decreased by $20 million due to changes in deferred compensation plan liabilities
and a $13 million research grant was received in fiscal year 2009. These decreases were partially offset by a $23 million increase in payroll
expense due to annual wage increases and a 53-week fiscal year in 2009 compared to
55
Fiscal Years Ended
(Dollars in millions)
July 3,
2009
June 27,
2008
Change
%
Change
Cost of revenue
$
8,395
$
9,503
$
(1,108
)
(12
)%
Gross margin
$
1,410
$
3,205
$
(1,795
)
(56
)%
Gross margin
percentage
14
%
25
%
Fiscal Years Ended
(Dollars in millions)
July 3,
2009
(1)
June 27,
2008
(1)
Change
%
Change
Product development
$
953
$
1,028
$
(75
)
(7
)%
Marketing and
administrative
537
659
(122
)
(19
)%
Amortization of
intangibles
55
54
1
2
%
Restructuring and
other, net
210
88
122
139
%
Impairment of
goodwill and other
long
-
lived assets
2,320
—
2,320
100
%
Operating expenses
$
4,075
$
1,829
$
2,246
(1) As adjusted due to a required change in the accounting for convertible debt instruments implemented in the
first quarter of 2010, applied on a retrospective basis.