Seagate 2009 Annual Report Download - page 61
Download and view the complete annual report
Please find page 61 of the 2009 Seagate annual report below. You can navigate through the pages in the report by either clicking on the pages listed below, or by using the keyword search tool below to find specific information within the annual report.-
 1
1 -
2
-
3
-
4
-
5
-
6
-
7
-
8
-
9
-
10
-
11
-
12
-
13
-
14
-
15
-
16
-
17
-
18
-
19
-
20
-
21
-
22
-
23
-
24
-
25
-
26
-
27
-
28
-
29
-
30
-
31
-
32
-
33
-
34
-
35
-
36
-
37
-
38
-
39
-
40
-
41
-
42
-
43
-
44
-
45
-
46
-
47
-
48
-
49
-
50
-
 51
51 -
 52
52 -
 53
53 -
 54
54 -
 55
55 -
 56
56 -
 57
57 -
 58
58 -
 59
59 -
 60
60 -
 61
61 -
 62
62 -
 63
63 -
 64
64 -
 65
65 -
 66
66 -
 67
67 -
 68
68 -
 69
69 -
 70
70 -
 71
71 -
72
-
73
-
74
-
75
-
76
-
77
-
78
-
79
-
80
-
81
-
82
-
83
-
84
-
85
-
86
-
87
-
88
-
89
-
90
-
91
-
92
-
93
-
94
-
95
-
96
-
97
-
98
-
99
-
100
-
101
-
102
-
103
-
104
-
105
-
106
-
107
-
108
-
109
-
110
-
111
-
112
-
113
-
114
-
115
-
116
-
117
-
118
-
119
-
120
-
121
-
122
-
123
-
124
-
125
-
126
-
127
-
128
-
129
-
130
-
131
-
132
-
133
-
134
-
135
-
136
-
137
-
138
-
139
-
140
-
141
-
142
-
143
-
144
-
145
-
146
-
147
-
148
-
149
-
150
-
151
-
152
-
153
-
154
-
155
-
156
-
157
-
158
-
159
-
160
-
161
-
162
-
163
-
164
-
165
-
166
-
167
-
168
-
169
-
170
-
171
-
172
-
173
-
174
-
175
-
176
-
177
-
178
-
179
-
180
-
181
-
182
-
183
-
184
-
185
-
186
-
187
-
188
-
189
-
190
-
191
-
192
-
193
-
194
-
195
-
196
-
197
-
198
-
199
-
200
-
201
-
202
-
203
-
204
-
205
-
206
-
207
-
208
-
209
-
210
-
211
-
212
-
213
-
214
-
215
-
216
-
217
-
218
-
219
-
220
-
221
-
222
-
223
-
224
-
225
-
226
-
227
-
228
-
229
-
230
-
231
-
232
-
233
-
234
-
235
-
236
-
237
-
238
-
239
-
240
-
241
-
242
-
243
-
244
-
245
-
246
-
247
-
248
-
249
-
250
-
251
-
252
 |
 |

Table of Contents
The increase in cash and cash equivalents was primarily a result of cash provided by operating activities of $1,932 million, the issuance of
the 2020 Notes for an aggregate principal amount of $600 million, and $86 million in proceeds from the exercise of stock options and employee
stock purchases, partially offset by the repayment of $350 million of our amended credit facility, $77 million for the repayment of our 6.8%
Convertible Senior Notes due April 2010 (the "6.8% Notes"), capital expenditures of $639 million, approximately $584 million to repurchase
32.4 million of our common shares and a $138 million net increase in short-term investments.
Our cash and cash equivalents are maintained in highly liquid investments with remaining maturities of 90 days or less at the time of
purchase. Our short-term investments consist primarily of readily marketable debt securities with remaining maturities of more than 90 days at
the time of purchase. As stated in our investment policy, we are averse to principal loss and seek to ensure the safety and preservation of our
invested funds by limiting default risk and market risk. We mitigate default risk by maintaining portfolio investments in diversified, high-quality
investment grade securities with limited time to maturity. We monitor our investment portfolio and position our portfolio to respond
appropriately to a reduction in credit rating of any investment issuer, guarantor or depository. We intend to maintain a highly liquid portfolio by
investing only in those marketable securities that we believe have active secondary or resale markets. We believe our cash equivalents and short-
term investments are liquid and accessible. We operate in some countries that may have restrictive regulations over the movement of cash and/or
foreign exchange across their borders. These restrictions have not impeded our ability to conduct business in those countries, nor do we expect
them to in the next 12 months. We are not aware of any downgrades, losses or other significant deterioration in the fair value of our cash
equivalents or short-term investments and accordingly, we do not believe the fair value of our short-term investments has significantly changed
from the values reported as of July 2, 2010.
The change in restricted cash and investments from the fiscal year ended July 3, 2009, was primarily due to the repayment of our
$300 million Floating Rate Senior Notes due 2009 at maturity and approximately $80 million of open market purchases of our 6.8% Notes and
6.375% Senior Notes due October 2011 (the "2011 Notes").
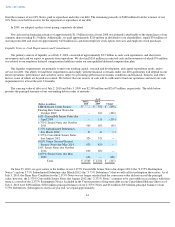
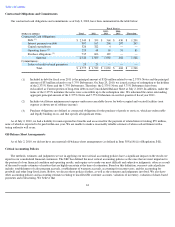
The following table summarizes results of statement of cash flows for the periods indicated:
Cash Provided by Operating Activities
Cash provided by operating activities for fiscal year 2010 was approximately $1,932 million and includes the effects of net income adjusted
for non-cash items including depreciation, amortization, stock-based compensation, impairment of long-lived assets, and:
•
an increase of $367 million in accounts receivable due to an increase in revenue; and
•
an increase of $170 million in inventories due to an increase in production requirements.
Cash provided by operating activities for fiscal year 2009 was approximately $823 million and includes the effects of a net loss adjusted for
non-cash items including depreciation, amortization, stock-based
59
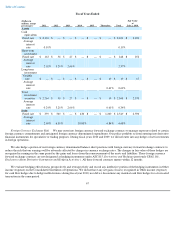
Fiscal Years Ended
(Dollars in millions)
July 2,
2010
July 3,
2009
June 27,
2008
Net cash flow provided by (used
in):
Operating activities
$
1,932
$
823
$
2,538
Investing activities
(752
)
(618
)
(991
)
Financing activities
(344
)
232
(1,545
)
Net increase in cash and cash
equivalents
$
836
$
437
$
2