Seagate 2009 Annual Report Download - page 52
Download and view the complete annual report
Please find page 52 of the 2009 Seagate annual report below. You can navigate through the pages in the report by either clicking on the pages listed below, or by using the keyword search tool below to find specific information within the annual report.-
 1
1 -
2
-
3
-
4
-
5
-
6
-
7
-
8
-
9
-
10
-
11
-
12
-
13
-
14
-
15
-
16
-
17
-
18
-
19
-
20
-
21
-
22
-
23
-
24
-
25
-
26
-
27
-
28
-
29
-
30
-
31
-
32
-
33
-
34
-
35
-
36
-
37
-
38
-
39
-
40
-
41
-
 42
42 -
 43
43 -
 44
44 -
 45
45 -
 46
46 -
 47
47 -
 48
48 -
 49
49 -
 50
50 -
 51
51 -
 52
52 -
 53
53 -
 54
54 -
 55
55 -
 56
56 -
 57
57 -
 58
58 -
 59
59 -
 60
60 -
 61
61 -
 62
62 -
63
-
64
-
65
-
66
-
67
-
68
-
69
-
70
-
71
-
72
-
73
-
74
-
75
-
76
-
77
-
78
-
79
-
80
-
81
-
82
-
83
-
84
-
85
-
86
-
87
-
88
-
89
-
90
-
91
-
92
-
93
-
94
-
95
-
96
-
97
-
98
-
99
-
100
-
101
-
102
-
103
-
104
-
105
-
106
-
107
-
108
-
109
-
110
-
111
-
112
-
113
-
114
-
115
-
116
-
117
-
118
-
119
-
120
-
121
-
122
-
123
-
124
-
125
-
126
-
127
-
128
-
129
-
130
-
131
-
132
-
133
-
134
-
135
-
136
-
137
-
138
-
139
-
140
-
141
-
142
-
143
-
144
-
145
-
146
-
147
-
148
-
149
-
150
-
151
-
152
-
153
-
154
-
155
-
156
-
157
-
158
-
159
-
160
-
161
-
162
-
163
-
164
-
165
-
166
-
167
-
168
-
169
-
170
-
171
-
172
-
173
-
174
-
175
-
176
-
177
-
178
-
179
-
180
-
181
-
182
-
183
-
184
-
185
-
186
-
187
-
188
-
189
-
190
-
191
-
192
-
193
-
194
-
195
-
196
-
197
-
198
-
199
-
200
-
201
-
202
-
203
-
204
-
205
-
206
-
207
-
208
-
209
-
210
-
211
-
212
-
213
-
214
-
215
-
216
-
217
-
218
-
219
-
220
-
221
-
222
-
223
-
224
-
225
-
226
-
227
-
228
-
229
-
230
-
231
-
232
-
233
-
234
-
235
-
236
-
237
-
238
-
239
-
240
-
241
-
242
-
243
-
244
-
245
-
246
-
247
-
248
-
249
-
250
-
251
-
252
 |
 |

Table of Contents
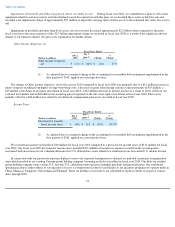
The following table summarizes information regarding volume shipments, average selling prices (ASPs) and revenues by channel and
geography:
Fiscal Year 2010 Compared to Fiscal Year 2009
Revenue
Revenue in fiscal year 2010 increased approximately 16%, or $1.6 billion, from fiscal year 2009 primarily due to an 18% increase in the
total number of disk drives shipped. This increase in revenue reflects an industry-wide supply constraint experienced in the first half of fiscal
year 2010 and a relatively balanced supply and demand environment during the March 2010 quarter resulting in muted price erosion. In the June
2010 quarter, industry supply exceeded demand and resulted in an increase in price erosion to levels typical of a June quarter.
We maintain various sales programs such as point-of-sale rebates, sales price adjustments and price protection, aimed at increasing
customer demand. We exercise judgment in formulating the underlying estimates related to distributor and retail inventory levels, sales program
participation and customer claims submittals in determining the provision for such programs. Sales programs recorded as contra revenue were
approximately 6% and 12% of our gross revenue for fiscal years 2010 and 2009, respectively.
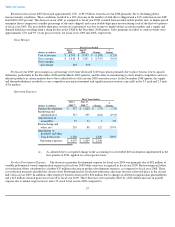
Gross Margin
50
Fiscal Years Ended
(In millions, except percentages and
ASPs)
July 2,
2010
July 3,
2009
June 27,
2008
Net Revenue
$
11,395
$
9,805
$
12,708
Unit Shipments:
Enterprise
25.4
22.3
28.3
Client Compute
135.0
114.9
126.2
Client Non
-
Compute
32.8
26.6
28.1
Total Units Shipped
193.2
163.8
182.6
ASPs (per unit)
$
58
$
59
$
68
Revenues by Channel (%)
OEM
71
%
64
%
67
%
Distributors
21
%
27
%
26
%
Retail
8
%
9
%
7
%
Revenues by Geography (%)
Americas
26
%
28
%
30
%
EMEA
22
%
27
%
27
%
Asia Pacific
52
%
45
%
43
%
Fiscal Years Ended
(Dollars in millions)
July 2,
2010
July 3,
2009
Change
%
Change
Revenue
$
11,395
$
9,805
$
1,590
16
%
Fiscal Years Ended
(Dollars in millions)
July 2,
2010 July 3,
2009 Change %
Change
Cost of revenue
$
8,191
$
8,395
$
(204
)
(2
)%
Gross margin
$
3,204
$
1,410
$
1,794
127
%
Gross margin
percentage
28
%
14
%