Seagate 2009 Annual Report Download - page 110
Download and view the complete annual report
Please find page 110 of the 2009 Seagate annual report below. You can navigate through the pages in the report by either clicking on the pages listed below, or by using the keyword search tool below to find specific information within the annual report.-
 1
1 -
2
-
3
-
4
-
5
-
6
-
7
-
8
-
9
-
10
-
11
-
12
-
13
-
14
-
15
-
16
-
17
-
18
-
19
-
20
-
21
-
22
-
23
-
24
-
25
-
26
-
27
-
28
-
29
-
30
-
31
-
32
-
33
-
34
-
35
-
36
-
37
-
38
-
39
-
40
-
41
-
42
-
43
-
44
-
45
-
46
-
47
-
48
-
49
-
50
-
51
-
52
-
53
-
54
-
55
-
56
-
57
-
58
-
59
-
60
-
61
-
62
-
63
-
64
-
65
-
66
-
67
-
68
-
69
-
70
-
71
-
72
-
73
-
74
-
75
-
76
-
77
-
78
-
79
-
80
-
81
-
82
-
83
-
84
-
85
-
86
-
87
-
88
-
89
-
90
-
91
-
92
-
93
-
94
-
95
-
96
-
97
-
98
-
99
-
 100
100 -
 101
101 -
 102
102 -
 103
103 -
 104
104 -
 105
105 -
 106
106 -
 107
107 -
 108
108 -
 109
109 -
 110
110 -
 111
111 -
 112
112 -
 113
113 -
 114
114 -
 115
115 -
 116
116 -
 117
117 -
 118
118 -
 119
119 -
 120
120 -
121
-
122
-
123
-
124
-
125
-
126
-
127
-
128
-
129
-
130
-
131
-
132
-
133
-
134
-
135
-
136
-
137
-
138
-
139
-
140
-
141
-
142
-
143
-
144
-
145
-
146
-
147
-
148
-
149
-
150
-
151
-
152
-
153
-
154
-
155
-
156
-
157
-
158
-
159
-
160
-
161
-
162
-
163
-
164
-
165
-
166
-
167
-
168
-
169
-
170
-
171
-
172
-
173
-
174
-
175
-
176
-
177
-
178
-
179
-
180
-
181
-
182
-
183
-
184
-
185
-
186
-
187
-
188
-
189
-
190
-
191
-
192
-
193
-
194
-
195
-
196
-
197
-
198
-
199
-
200
-
201
-
202
-
203
-
204
-
205
-
206
-
207
-
208
-
209
-
210
-
211
-
212
-
213
-
214
-
215
-
216
-
217
-
218
-
219
-
220
-
221
-
222
-
223
-
224
-
225
-
226
-
227
-
228
-
229
-
230
-
231
-
232
-
233
-
234
-
235
-
236
-
237
-
238
-
239
-
240
-
241
-
242
-
243
-
244
-
245
-
246
-
247
-
248
-
249
-
250
-
251
-
252
 |
 |

Table of Contents
SEAGATE TECHNOLOGY
NOTES TO CONSOLIDATED FINANCIAL STATEMENTS—(Continued)
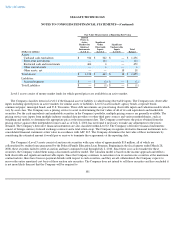
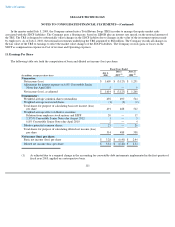
Items Measured at Fair Value on a Non-Recurring Basis
The following table presents the Company's assets and liabilities that were measured at fair value on a non-
recurring basis during fiscal year
2010.
On September 29, 2009, the Company committed to a plan to sell certain equipment related to certain research activities that have ceased.
The Company expects the sale of these assets to be completed no later than the end of its first quarter of fiscal year 2011. During fiscal year
2010, the Company recognized a charge of $57 million in Impairment of long-lived assets, net of $7 million in recoveries, which is recorded in
its Consolidated Statement of Operations for the fiscal year ended July 2, 2010 in order to write down the carrying amount of these assets to the
then estimated fair value of $11 million less costs to sell as of September 29, 2009. The Company used a combination of the market and cost
approaches in order to determine the fair value of assets held for sale. The methodology employed involved applying market derived factors,
which represented the discount that a market participant would expect to pay for a used asset based on estimated replacement cost. The discounts
applied to replacement costs, which consider all forms of physical, functional and economic obsolescence, were obtained from discussions with
brokers and other market participants. As the valuation of the Company's assets held for sale contained unobservable inputs, they were classified
as Level 3 inputs.
During the second quarter of fiscal year 2010, the Company determined that one of its equity investments accounted for under the cost
method was other-than-temporarily impaired, and recognized a charge of $13 million in order to write down the carrying amount of the
investment to estimated fair value, which was recorded in Other, net in its Consolidated Statements of Operations for the fiscal year ended
July 2, 2010. Since there was no active market for the equity securities of the investee, the Company estimated fair value of the investee by using
the market approach to estimate the fair value of its underlying intellectual property assets at the end of the first quarter of fiscal 2010.
103
Fair Value Measurements Using
(Dollars in millions)
Quoted
Prices in
Active
Markets for
Identical
Instruments
(Level 1)
Significant
Other
Observable
Inputs
(Level 2)
Significant
Unobservable
Inputs
(Level 3)
Total
Balance
Assets:
Assets held for sale
$
—
$
—
$
11
$
11
Equity investment
$
—
$
—
$
4
$
4