Seagate 2009 Annual Report Download - page 63
Download and view the complete annual report
Please find page 63 of the 2009 Seagate annual report below. You can navigate through the pages in the report by either clicking on the pages listed below, or by using the keyword search tool below to find specific information within the annual report.-
 1
1 -
2
-
3
-
4
-
5
-
6
-
7
-
8
-
9
-
10
-
11
-
12
-
13
-
14
-
15
-
16
-
17
-
18
-
19
-
20
-
21
-
22
-
23
-
24
-
25
-
26
-
27
-
28
-
29
-
30
-
31
-
32
-
33
-
34
-
35
-
36
-
37
-
38
-
39
-
40
-
41
-
42
-
43
-
44
-
45
-
46
-
47
-
48
-
49
-
50
-
51
-
52
-
 53
53 -
 54
54 -
 55
55 -
 56
56 -
 57
57 -
 58
58 -
 59
59 -
 60
60 -
 61
61 -
 62
62 -
 63
63 -
 64
64 -
 65
65 -
 66
66 -
 67
67 -
 68
68 -
 69
69 -
 70
70 -
 71
71 -
 72
72 -
 73
73 -
74
-
75
-
76
-
77
-
78
-
79
-
80
-
81
-
82
-
83
-
84
-
85
-
86
-
87
-
88
-
89
-
90
-
91
-
92
-
93
-
94
-
95
-
96
-
97
-
98
-
99
-
100
-
101
-
102
-
103
-
104
-
105
-
106
-
107
-
108
-
109
-
110
-
111
-
112
-
113
-
114
-
115
-
116
-
117
-
118
-
119
-
120
-
121
-
122
-
123
-
124
-
125
-
126
-
127
-
128
-
129
-
130
-
131
-
132
-
133
-
134
-
135
-
136
-
137
-
138
-
139
-
140
-
141
-
142
-
143
-
144
-
145
-
146
-
147
-
148
-
149
-
150
-
151
-
152
-
153
-
154
-
155
-
156
-
157
-
158
-
159
-
160
-
161
-
162
-
163
-
164
-
165
-
166
-
167
-
168
-
169
-
170
-
171
-
172
-
173
-
174
-
175
-
176
-
177
-
178
-
179
-
180
-
181
-
182
-
183
-
184
-
185
-
186
-
187
-
188
-
189
-
190
-
191
-
192
-
193
-
194
-
195
-
196
-
197
-
198
-
199
-
200
-
201
-
202
-
203
-
204
-
205
-
206
-
207
-
208
-
209
-
210
-
211
-
212
-
213
-
214
-
215
-
216
-
217
-
218
-
219
-
220
-
221
-
222
-
223
-
224
-
225
-
226
-
227
-
228
-
229
-
230
-
231
-
232
-
233
-
234
-
235
-
236
-
237
-
238
-
239
-
240
-
241
-
242
-
243
-
244
-
245
-
246
-
247
-
248
-
249
-
250
-
251
-
252
 |
 |

Table of Contents
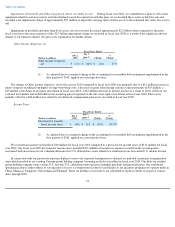
from the issuance of our 10% Notes, paid to repurchase and retire our debt. The remaining proceeds of $380 million from the issuance of our
10% Notes were held in escrow for the repayment or repurchase of our debt.
In 2009, we adopted a policy of not paying a quarterly dividend.
Net cash used in financing activities of approximately $1.5 billion for fiscal year 2008 was primarily attributable to the repurchases of our
common shares totaling $1.5 billion. Additionally, we paid approximately $216 million in dividends to our shareholders, repaid $34 million of
our long-term debt and received approximately $178 million in cash from employee stock option exercises and employee stock purchases.
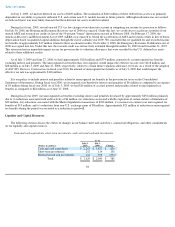
Liquidity Sources, Cash Requirements and Commitments
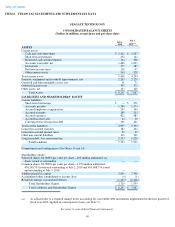
Our primary sources of liquidity as of July 2, 2010, consisted of approximately $2.5 billion in cash, cash equivalents, and short-term
investments and cash we expect to generate from operations. We also had $114 million in restricted cash and investments of which $76 million
was related to our employee deferred compensation liabilities under our non-qualified deferred compensation plan.
Our liquidity requirements are primarily to meet our working capital, research and development, and capital expenditure needs, and to
service our debt. Our ability to fund these requirements and comply with the financial covenants under our debt agreements will depend on our
future operations, performance and cash flow and is subject to prevailing global macroeconomic conditions and financial, business and other
factors, some of which are beyond our control. We believe that our sources of cash will be sufficient to fund our operations and meet our cash
requirements for at least the next 12 months.
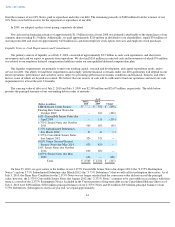
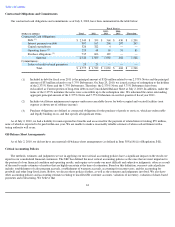
The carrying value of debt as of July 2, 2010 and July 3, 2009 was $2,500 million and $2,697 million, respectively. The table below
presents the principal amounts of our outstanding debt in order of maturity:
On June 25, 2010, we gave notice to the holders of our 2.375% Convertible Senior Notes due August 2012 (the "2.375% Redemption
Notice") and our 5.75% Subordinated Debentures due March 2012 (the "5.75% Debentures") that we will call for redemption these notes. As of
July 3, 2010, the Share Price Condition for the 2.375% Notes was no longer satisfied and the conversion value did not exceed the principal
value; however, the 2.375% Convertible Senior Notes due August 2012 (the "2.375% Notes") continue to be convertible in accordance with their
terms as a result of the 2.375% Redemption Notice. Included in the Current portion of long-term debt on our Consolidated Balance Sheet as of
July 2, 2010 were $298 million ($326 million principal balance) of our 2.375% Notes and $31 million ($33 million principal balance) of our
5.75% Debentures. Subsequent to our fiscal year end, we repaid approximately
61
As of
(Dollars in millions)
July 2,
2010 July 3,
2009 Change
LIBOR Based Credit Facility
$
—
$
350
$
(350
)
Floating Rate Senior Notes due
October 2009
—
300
(300
)
6.8% Convertible Senior Notes due
April 2010
—
116
(116
)
6.375% Senior Notes due October
2011
560
600
(40
)
5.75% Subordinated Debentures
due March 2012
33
40
(7
)
2.375% Convertible Senior Notes
due August 2012
326
326
—
10.0% Senior Secured Second-
Priority Notes due May 2014
430
430
—
6.8% Senior Notes due October
2016
600
600
—
6.875% Senior Notes due May
2020
600
—
600
Total
$
2,549
$
2,762
$
(213
)