Seagate 2006 Annual Report Download - page 70
Download and view the complete annual report
Please find page 70 of the 2006 Seagate annual report below. You can navigate through the pages in the report by either clicking on the pages listed below, or by using the keyword search tool below to find specific information within the annual report.-
 1
1 -
2
-
3
-
4
-
5
-
6
-
7
-
8
-
9
-
10
-
11
-
12
-
13
-
14
-
15
-
16
-
17
-
18
-
19
-
20
-
21
-
22
-
23
-
24
-
25
-
26
-
27
-
28
-
29
-
30
-
31
-
32
-
33
-
34
-
35
-
36
-
37
-
38
-
39
-
40
-
41
-
42
-
43
-
44
-
45
-
46
-
47
-
48
-
49
-
50
-
51
-
52
-
53
-
54
-
55
-
56
-
57
-
58
-
59
-
 60
60 -
 61
61 -
 62
62 -
 63
63 -
 64
64 -
 65
65 -
 66
66 -
 67
67 -
 68
68 -
 69
69 -
 70
70 -
 71
71 -
 72
72 -
 73
73 -
 74
74 -
 75
75 -
 76
76 -
 77
77 -
 78
78 -
 79
79 -
 80
80 -
81
-
82
-
83
-
84
-
85
-
86
-
87
-
88
-
89
-
90
-
91
-
92
-
93
-
94
-
95
-
96
-
97
-
98
-
99
-
100
-
101
-
102
-
103
-
104
-
105
-
106
-
107
-
108
-
109
-
110
-
111
-
112
-
113
-
114
-
115
-
116
-
117
-
118
-
119
-
120
-
121
-
122
-
123
-
124
-
125
-
126
-
127
-
128
-
129
-
130
-
131
-
132
-
133
-
134
-
135
-
136
-
137
-
138
-
139
-
140
-
141
-
142
-
143
-
144
-
145
-
146
-
147
-
148
 |
 |

Table of Contents
SEAGATE TECHNOLOGY
NOTES TO CONSOLIDATED FINANCIAL STATEMENTS — (Continued)
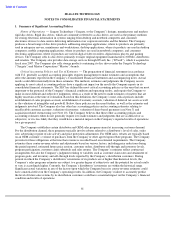
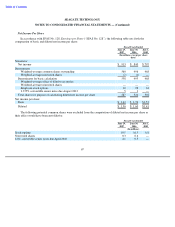
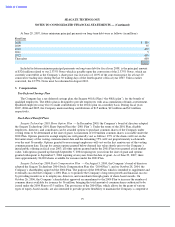
Net Income Per Share
In accordance with SFAS No. 128, Earnings per Share (“SFAS No. 128”), the following table sets forth the
computation of basic and diluted net income per share:
The following potential common shares were excluded from the computation of diluted net income per share as
their effect would have been anti-dilutive:
67
Fiscal Years Ended
June 29,
June 30,
July 1,
2007
2006
2005
(In millions, except per share
data)
Numerator
Net income
$
913
$
840
$
707
Denominator
Weighted
-
average common shares outstanding
560
496
468
Weighted
-
average nonvested shares
(2
)
(1
)
—
Denominator for basic calculation
558
495
468
Weighted
-
average effect of dilutive securities:
Weighted
-
average nonvested shares
—
—
—
Employee stock options
24
28
34
2.375% convertible senior notes due August 2012
5
1
—
Total shares for purpose of calculating diluted net income per share
587
524
502
Net income per share:
Basic
$
1.64
$
1.70
$
1.51
Diluted
$
1.56
$
1.60
$
1.41
Fiscal Years Ended
June 29,
June 30,
July 1,
2007
2006
2005
(In millions)
Stock options
19.5
16.5
6.8
Nonvested shares
0.3
0.6
—
6.8% convertible senior notes due April 2010
4.1
0.5
—