Seagate 2006 Annual Report Download - page 46
Download and view the complete annual report
Please find page 46 of the 2006 Seagate annual report below. You can navigate through the pages in the report by either clicking on the pages listed below, or by using the keyword search tool below to find specific information within the annual report.-
 1
1 -
2
-
3
-
4
-
5
-
6
-
7
-
8
-
9
-
10
-
11
-
12
-
13
-
14
-
15
-
16
-
17
-
18
-
19
-
20
-
21
-
22
-
23
-
24
-
25
-
26
-
27
-
28
-
29
-
30
-
31
-
32
-
33
-
34
-
35
-
 36
36 -
 37
37 -
 38
38 -
 39
39 -
 40
40 -
 41
41 -
 42
42 -
 43
43 -
 44
44 -
 45
45 -
 46
46 -
 47
47 -
 48
48 -
 49
49 -
 50
50 -
 51
51 -
 52
52 -
 53
53 -
 54
54 -
 55
55 -
 56
56 -
57
-
58
-
59
-
60
-
61
-
62
-
63
-
64
-
65
-
66
-
67
-
68
-
69
-
70
-
71
-
72
-
73
-
74
-
75
-
76
-
77
-
78
-
79
-
80
-
81
-
82
-
83
-
84
-
85
-
86
-
87
-
88
-
89
-
90
-
91
-
92
-
93
-
94
-
95
-
96
-
97
-
98
-
99
-
100
-
101
-
102
-
103
-
104
-
105
-
106
-
107
-
108
-
109
-
110
-
111
-
112
-
113
-
114
-
115
-
116
-
117
-
118
-
119
-
120
-
121
-
122
-
123
-
124
-
125
-
126
-
127
-
128
-
129
-
130
-
131
-
132
-
133
-
134
-
135
-
136
-
137
-
138
-
139
-
140
-
141
-
142
-
143
-
144
-
145
-
146
-
147
-
148
 |
 |

Table of Contents
Fiscal Year 2007 Compared to Fiscal Year 2006
The fiscal year 2007 results include the results of Maxtor for the entire year, while fiscal year 2006 include the
results of Maxtor from May 19, 2006 to June 30, 2006. In connection with the Maxtor acquisition, we incurred a
number of accounting charges and other costs, which impacted our earnings for the entire fiscal year 2007 and during
the fourth quarter of fiscal year 2006.
Revenue. Revenue for fiscal year 2007 was approximately $11.4 billion, up 23% from approximately
$9.2 billion in fiscal year 2006. The increase in revenue from fiscal year 2006 was driven by a 34% increase in the
unit volume of disc drives shipped from 118.7 million units to 159.2 million units principally as a result of the
retention of a portion of Maxtor’s market share, offset by a 9% reduction in our average sales price from $78 to $71
per unit and a weaker than anticipated demand for large capacity 3.5-inch ATA disc drives. The comparative
decrease in average sales price per unit in the period resulted from price erosion that more than offset improved
product mix.
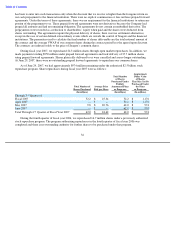
Unit shipments for our products in fiscal year 2007 were as follows:
We maintain various sales programs aimed at increasing customer demand. We exercise judgment in
formulating the underlying estimates related to distributor and retail inventory levels, sales program participation and
customer claims submittals in determining the provision for such programs. During fiscal year 2007, sales programs
recorded as contra revenue, were approximately 9% of our gross revenue, compared to 7% of our gross revenue for
fiscal year 2006. The increase in sales programs as a percentage of gross revenue from fiscal year 2006 was primarily
the result of a higher mix of sales to distributors and retail customers which generally require higher program support
than OEM sales and to a more aggressive pricing environment. Point-of-sale rebates, sales price adjustments and
price protection accounted for a substantial portion of the increase in sales programs.
Cost of Revenue. Cost of revenue for fiscal year 2007 was approximately $9.2 billion, up 30% from
approximately $7.1 billion in fiscal year 2006, principally as a result of the acquisition of Maxtor. Gross margin as a
percentage of revenue for fiscal year 2007 was 19% as compared with 23% for fiscal year 2006.
43
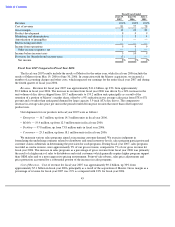
Fiscal Years Ended
June 29,
June 30,
July 1,
2007
2006
2005
Revenue
100
%
100
%
100
%
Cost of revenue
81
77
78
Gross margin
19
23
22
Product development
8
9
9
Marketing and administrative
5
5
4
Amortization of intangibles
1
—
—
Restructuring and other
—
—
—
Income from operations
5
9
9
Other income (expense), net
—
1
—
Income before income taxes
5
10
9
Provision for (benefit from) income taxes
(3
)
1
—
Net income
8
%
9
%
9
%
•
Enterprise
—
16.7 million, up from 14.3 million units in fiscal year 2006.
•
Mobile
—
19.4 million, up from 12.5 million units in fiscal year 2006.
•
Desktop
—
97.8 million, up from 73.8 million units in fiscal year 2006.
•
Consumer
—
25.3 million, up from 18.1 million units in fiscal year 2006.