Seagate 2006 Annual Report Download - page 109
Download and view the complete annual report
Please find page 109 of the 2006 Seagate annual report below. You can navigate through the pages in the report by either clicking on the pages listed below, or by using the keyword search tool below to find specific information within the annual report.-
 1
1 -
2
-
3
-
4
-
5
-
6
-
7
-
8
-
9
-
10
-
11
-
12
-
13
-
14
-
15
-
16
-
17
-
18
-
19
-
20
-
21
-
22
-
23
-
24
-
25
-
26
-
27
-
28
-
29
-
30
-
31
-
32
-
33
-
34
-
35
-
36
-
37
-
38
-
39
-
40
-
41
-
42
-
43
-
44
-
45
-
46
-
47
-
48
-
49
-
50
-
51
-
52
-
53
-
54
-
55
-
56
-
57
-
58
-
59
-
60
-
61
-
62
-
63
-
64
-
65
-
66
-
67
-
68
-
69
-
70
-
71
-
72
-
73
-
74
-
75
-
76
-
77
-
78
-
79
-
80
-
81
-
82
-
83
-
84
-
85
-
86
-
87
-
88
-
89
-
90
-
91
-
92
-
93
-
94
-
95
-
96
-
97
-
98
-
 99
99 -
 100
100 -
 101
101 -
 102
102 -
 103
103 -
 104
104 -
 105
105 -
 106
106 -
 107
107 -
 108
108 -
 109
109 -
 110
110 -
 111
111 -
 112
112 -
 113
113 -
 114
114 -
 115
115 -
 116
116 -
 117
117 -
 118
118 -
 119
119 -
120
-
121
-
122
-
123
-
124
-
125
-
126
-
127
-
128
-
129
-
130
-
131
-
132
-
133
-
134
-
135
-
136
-
137
-
138
-
139
-
140
-
141
-
142
-
143
-
144
-
145
-
146
-
147
-
148
 |
 |

Table of Contents
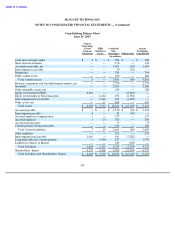
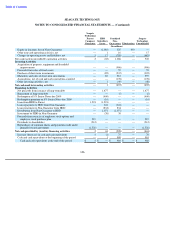
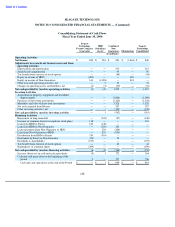
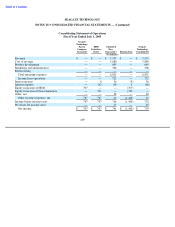
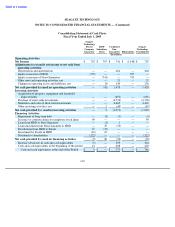
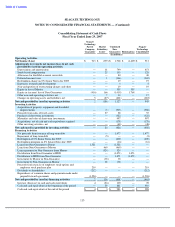
SEAGATE TECHNOLOGY
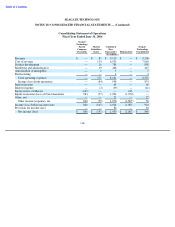
NOTES TO CONSOLIDATED FINANCIAL STATEMENTS — (Continued)
106
Seagate
Technology
Parent
HDD
Combined
Seagate
Company
Subsidiary
Non
-
Technology
Guarantor
Issuer
Guarantors
Eliminations
Consolidated
(In millions)
Equity in (income) loss of Non
-
Guarantors
—
(
1,018
)
525
493
—
Other non
-
cash operating activities, net
—
1
16
—
17
Changes in operating assets and liabilities, net
5
17
(705
)
—
(
683
)
Net cash (used in) provided by operating activities
2
(65
)
1,006
—
943
Investing Activities
Acquisition of property, equipment and leasehold
improvements
—
—
(
906
)
—
(
906
)
Proceeds from sales of fixed assets
—
—
55
—
55
Purchase of short
-
term investments
—
(
85
)
(237
)
—
(
322
)
Maturities and sales of short
-
term investments
—
85
912
—
997
Acquisitions, net of cash and cash equivalents acquired
—
—
(
178
)
—
(
178
)
Other investing activities, net
—
1
(49
)
—
(
48
)
Net cash used in investing activities
—
1
(403
)
—
(
402
)
Financing Activities
Net proceeds from issuance of long
-
term debt
—
1,477
—
—
1,477
Repayment of long
-
term debt
—
—
(
5
)
—
(
5
)
Redemption of 8% Senior Notes due 2009
—
(
400
)
—
—
(
400
)
Redemption premium on 8% Senior Notes due 2009
—
(
16
)
—
—
(
16
)
Loan from HDD to Parent
1,521
(1,521
)
—
—
—
Loan repayment to HDD from Non
-
Guarantor
—
324
(324
)
—
—
Loan repayment to Non
-
Guarantor from HDD
—
(
834
)
834
—
—
Distribution from Non
-
Guarantor to HDD
—
1,071
(1,071
)
—
—
Investment by HDD in Non
-
Guarantor
—
(
38
)
38
—
—
Proceeds from exercise of employee stock options and
employee stock purchase plan
219
—
—
—
219
Dividends to shareholders
(212
)
—
—
—
(
212
)
Repurchases of common shares and payments made under
prepaid forward agreements
(1,526
)
—
—
—
(
1,526
)
Net cash provided by (used in) financing activities
2
63
(528
)
—
(
463
)
Increase (decrease) in cash and cash equivalents
4
(1
)
75
—
78
Cash and cash equivalents at the beginning of the period
—
1
909
—
910
Cash and cash equivalents at the end of the period
$
4
$
—
$
984
$
—
$
988