Seagate 2006 Annual Report Download - page 35
Download and view the complete annual report
Please find page 35 of the 2006 Seagate annual report below. You can navigate through the pages in the report by either clicking on the pages listed below, or by using the keyword search tool below to find specific information within the annual report.-
 1
1 -
2
-
3
-
4
-
5
-
6
-
7
-
8
-
9
-
10
-
11
-
12
-
13
-
14
-
15
-
16
-
17
-
18
-
19
-
20
-
21
-
22
-
23
-
24
-
 25
25 -
 26
26 -
 27
27 -
 28
28 -
 29
29 -
 30
30 -
 31
31 -
 32
32 -
 33
33 -
 34
34 -
 35
35 -
 36
36 -
 37
37 -
 38
38 -
 39
39 -
 40
40 -
 41
41 -
 42
42 -
 43
43 -
 44
44 -
 45
45 -
46
-
47
-
48
-
49
-
50
-
51
-
52
-
53
-
54
-
55
-
56
-
57
-
58
-
59
-
60
-
61
-
62
-
63
-
64
-
65
-
66
-
67
-
68
-
69
-
70
-
71
-
72
-
73
-
74
-
75
-
76
-
77
-
78
-
79
-
80
-
81
-
82
-
83
-
84
-
85
-
86
-
87
-
88
-
89
-
90
-
91
-
92
-
93
-
94
-
95
-
96
-
97
-
98
-
99
-
100
-
101
-
102
-
103
-
104
-
105
-
106
-
107
-
108
-
109
-
110
-
111
-
112
-
113
-
114
-
115
-
116
-
117
-
118
-
119
-
120
-
121
-
122
-
123
-
124
-
125
-
126
-
127
-
128
-
129
-
130
-
131
-
132
-
133
-
134
-
135
-
136
-
137
-
138
-
139
-
140
-
141
-
142
-
143
-
144
-
145
-
146
-
147
-
148
 |
 |
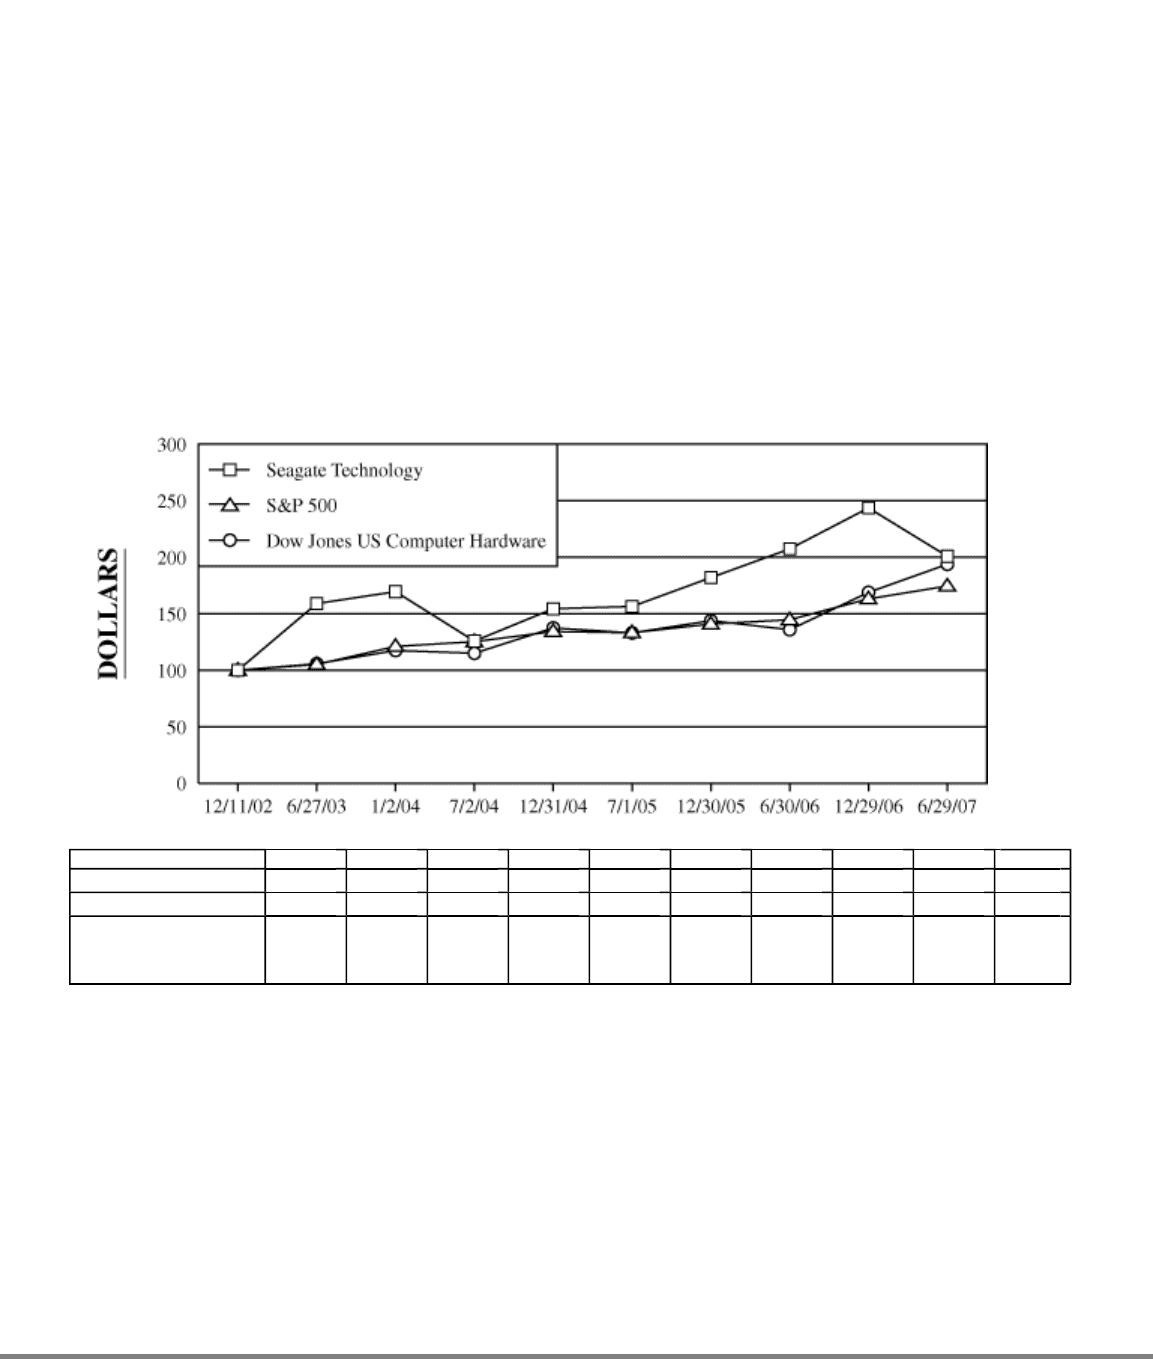
Table of Contents
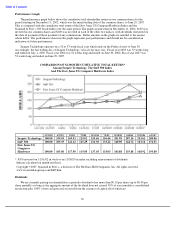
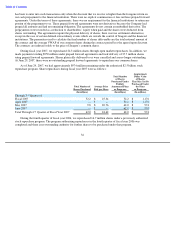
Performance Graph
The performance graph below shows the cumulative total shareholder return on our common shares for the
period starting on December 11, 2002, which was the initial trading date of the common shares, to June 29, 2007.
This is compared with the cumulative total return of the Dow Jones US Computer Hardware Index and the
Standard & Poor’s 500 Stock Index over the same period. The graph assumes that on December 11, 2002, $100 was
invested in our common shares and $100 was invested in each of the other two indices, with dividends reinvested on
the date of payment without payment of any commissions. Dollar amounts in the graph are rounded to the nearest
whole dollar. The performance shown in the graph represents past performance and should not be considered an
indication of future performance.
Seagate Technology operates on a 52 or 53 week fiscal year which ends on the Friday closest to June 30.
Accordingly, the last trading day of Seagate Technology’s fiscal year may vary. Fiscal year 2005 was 52 weeks long
and ended on July 1, 2005. Fiscal year 2006 was 52 weeks long and ended on June 30, 2006. Fiscal year 2007 was
52 weeks long and ended on June 29, 2007.
COMPARISON OF 54 MONTH CUMULATIVE TOTAL RETURN*
Among Seagate Technology, The S&P 500 Index
And The Dow Jones US Computer Hardware Index
Indexes calculated on month-end basis.
Copyright
©
2007, Standard & Poor’s, a division of The McGraw-Hill Companies, Inc. All rights reserved.
www.researchdatagroup.com/S&P.htm
Dividends
We are currently paying our shareholders a quarterly dividend of no more than $0.10 per share (up to $0.40 per
share annually) so long as the aggregate amount of the dividend does not exceed 50% of our cumulative consolidated
net income plus 100% of net cash proceeds received from the issuance of capital all of which are
32
12/11/02
6/27/03
1/2/04
7/2/04
12/31/04
7/1/05
12/30/05
6/30/06
12/29/06
6/29/07
Seagate Technology
100.00
159.03
169.53
125.81
154.46
156.44
181.98
207.36
243.61
200.86
S&P 500
100.00
105.19
121.12
125.29
134.30
133.22
140.90
144.72
163.16
174.51
Dow Jones US
Computer
Hardware
100.00
105.80
117.50
115.05
137.45
133.03
143.88
135.88
168.92
193.80
*
$100 invested on 12/11/02 in stock or on 11/30/20 in index
-
including reinvestment of dividends.