Seagate 2006 Annual Report Download - page 121
Download and view the complete annual report
Please find page 121 of the 2006 Seagate annual report below. You can navigate through the pages in the report by either clicking on the pages listed below, or by using the keyword search tool below to find specific information within the annual report.-
 1
1 -
2
-
3
-
4
-
5
-
6
-
7
-
8
-
9
-
10
-
11
-
12
-
13
-
14
-
15
-
16
-
17
-
18
-
19
-
20
-
21
-
22
-
23
-
24
-
25
-
26
-
27
-
28
-
29
-
30
-
31
-
32
-
33
-
34
-
35
-
36
-
37
-
38
-
39
-
40
-
41
-
42
-
43
-
44
-
45
-
46
-
47
-
48
-
49
-
50
-
51
-
52
-
53
-
54
-
55
-
56
-
57
-
58
-
59
-
60
-
61
-
62
-
63
-
64
-
65
-
66
-
67
-
68
-
69
-
70
-
71
-
72
-
73
-
74
-
75
-
76
-
77
-
78
-
79
-
80
-
81
-
82
-
83
-
84
-
85
-
86
-
87
-
88
-
89
-
90
-
91
-
92
-
93
-
94
-
95
-
96
-
97
-
98
-
99
-
100
-
101
-
102
-
103
-
104
-
105
-
106
-
107
-
108
-
109
-
110
-
 111
111 -
 112
112 -
 113
113 -
 114
114 -
 115
115 -
 116
116 -
 117
117 -
 118
118 -
 119
119 -
 120
120 -
 121
121 -
 122
122 -
 123
123 -
 124
124 -
 125
125 -
 126
126 -
 127
127 -
 128
128 -
 129
129 -
 130
130 -
 131
131 -
132
-
133
-
134
-
135
-
136
-
137
-
138
-
139
-
140
-
141
-
142
-
143
-
144
-
145
-
146
-
147
-
148
 |
 |

Table of Contents
SEAGATE TECHNOLOGY
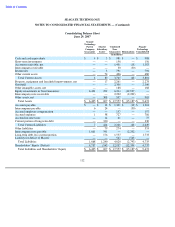
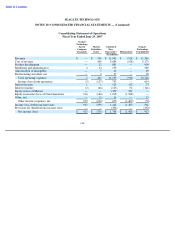
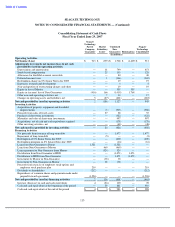
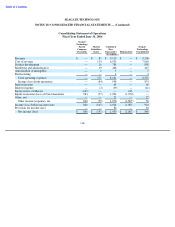
NOTES TO CONSOLIDATED FINANCIAL STATEMENTS — (Continued)
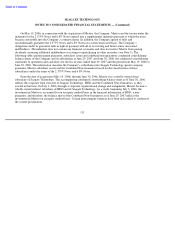
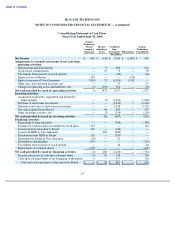
Quarterly Data
The Company operated and reported financial results based on 13 week quarters in fiscal 2007 and 2006, which
ended on the Friday closest to September 30, December 31, March 31, and June 30.
The results for the first quarter of fiscal year 2007 include a $40 million increase in the provision for doubtful
accounts related to the termination of the Company’s distributor relationship with eSys and its related affiliated
entities, approximately $24 million of stock-based compensation, Maxtor’s operating losses and related charges to
the Company’s acquisition of Maxtor which include $34 million in integration and retention costs, net of related tax
effects, $34 million in the amortization of intangibles and $13 million in stock-
based compensation charges related to
Maxtor options assumed and nonvested shares exchanged, net of related tax effects.
The results for the second quarter of fiscal year 2007 include approximately $25 million of stock-based
compensation, $19 million in charges related to the redemption of the Company’s 8% Notes, Maxtor’s operating
losses and charges related to the Company’s acquisition of Maxtor Corporation which include $10 million in
integration and retention costs, net of related tax effects, $40 million in the amortization of intangibles, $18 million in
customer compensatory claims relating to legacy Maxtor products and $7 million in stock-based compensation
charges related to Maxtor options assumed and nonvested shares exchanged.
The results for the third quarter of fiscal year 2007 include approximately $29 million of stock-based
compensation and charges related to the Company’s acquisition of Maxtor, which include $53 million in the
amortization of intangibles.
The results for the fourth quarter include a $359 million tax benefit resulting from a favorable adjustment to the
valuation allowance related to our deferred tax assets, $24 million of stock-based compensation expense, a
$29 million net restructuring and impairment charges and $23 million in amortization of intangibles related to the
Maxtor acquisition.
118
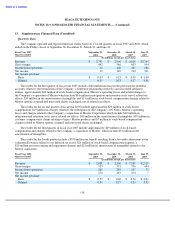
15.
Supplementary Financial Data (Unaudited)
Fiscal Year 2007
September 29,
December 29,
March 30,
June 29,
Quarters Ended
2006
2006
2007
2007
(In millions, except per share data)
Revenue
$
2,793
$
2,996
$
2,828
$
2,744
Gross margin
442
546
603
594
Income from operations
12
166
247
188
Net income
19
140
212
541
Net income per share:
Basic
$
0.03
$
0.25
$
0.39
$
1.00
Diluted
0.03
0.23
0.37
0.96
Fiscal Year 2006
September 30,
December 30,
March 31,
June 29,
Quarters Ended
2005
2005
2006
2007
(In millions, except per share data)
Revenue
$
2,088
$
2,300
$
2,289
$
2,529
Gross margin
535
591
556
454
Income from operations
265
284
253
72
Net income
272
287
274
7
Net income per share:
Basic
$
0.57
$
0.60
$
0.56
$
0.01
Diluted
0.54
0.57
0.53
0.01