Seagate 2006 Annual Report Download - page 49
Download and view the complete annual report
Please find page 49 of the 2006 Seagate annual report below. You can navigate through the pages in the report by either clicking on the pages listed below, or by using the keyword search tool below to find specific information within the annual report.-
 1
1 -
2
-
3
-
4
-
5
-
6
-
7
-
8
-
9
-
10
-
11
-
12
-
13
-
14
-
15
-
16
-
17
-
18
-
19
-
20
-
21
-
22
-
23
-
24
-
25
-
26
-
27
-
28
-
29
-
30
-
31
-
32
-
33
-
34
-
35
-
36
-
37
-
38
-
 39
39 -
 40
40 -
 41
41 -
 42
42 -
 43
43 -
 44
44 -
 45
45 -
 46
46 -
 47
47 -
 48
48 -
 49
49 -
 50
50 -
 51
51 -
 52
52 -
 53
53 -
 54
54 -
 55
55 -
 56
56 -
 57
57 -
 58
58 -
 59
59 -
60
-
61
-
62
-
63
-
64
-
65
-
66
-
67
-
68
-
69
-
70
-
71
-
72
-
73
-
74
-
75
-
76
-
77
-
78
-
79
-
80
-
81
-
82
-
83
-
84
-
85
-
86
-
87
-
88
-
89
-
90
-
91
-
92
-
93
-
94
-
95
-
96
-
97
-
98
-
99
-
100
-
101
-
102
-
103
-
104
-
105
-
106
-
107
-
108
-
109
-
110
-
111
-
112
-
113
-
114
-
115
-
116
-
117
-
118
-
119
-
120
-
121
-
122
-
123
-
124
-
125
-
126
-
127
-
128
-
129
-
130
-
131
-
132
-
133
-
134
-
135
-
136
-
137
-
138
-
139
-
140
-
141
-
142
-
143
-
144
-
145
-
146
-
147
-
148
 |
 |

Table of Contents
limitation associated with the January 3, 2005 change. To the extent we believe it is more likely than not that the
deferred tax assets associated with tax attributes subject to this IRC Section 382 limitation will not be realized, a
valuation allowance has been provided.
The Internal Revenue Service (“IRS”) is currently examining our federal income tax returns for fiscal years
ending in 2001 through 2004. The timing of the settlement of these examinations is uncertain. We believe that
adequate amounts of tax have been provided for any final assessments that may result.
Fiscal Year 2006 Compared to Fiscal Year 2005
The fiscal year 2006 results include the results of Maxtor for the six weeks from the closing date of the
acquisition of May 19, 2006 through June 30, 2006. In connection with the Maxtor acquisition, we incurred a number
of accounting charges and other costs, which impacted our earnings for the last quarter of and the entire fiscal year
2006.
Revenue. Revenue for fiscal year 2006 was approximately $9.2 billion, up 22% from approximately
$7.6 billion in fiscal year 2005. The increase in revenue was primarily due to record disc drive shipments of
118.7 million units in fiscal year 2006 compared to 98.1 million units in fiscal year 2005, as well as an improved
product mix of our new products, offset by price erosion. Our overall average sales price per unit (ASP) for our
products was $78 for fiscal year 2006, up from $77 in fiscal year 2005.
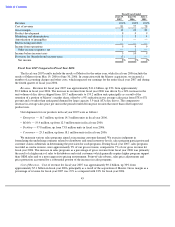
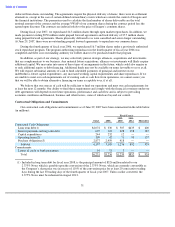
Unit shipments for our products in fiscal year 2006 were as follows:
We maintained various sales programs aimed at increasing customer demand. We exercise judgment in
formulating the underlying estimates related to distributor inventory levels, sales program participation and
customer claims submittals in determining the provision for such programs. During fiscal year
2006, sales programs
recorded as contra revenue were approximately 7% of our gross revenue, compared to 5% of our gross revenue for
fiscal year 2005. The increase in sales programs as a percentage of gross revenue was primarily the result of higher
price erosion in the distribution channel and growth in retail sales, which typically require higher point-of-sale
rebates.
Cost of Revenue. Cost of revenue for fiscal year 2006 was approximately $7.1 billion, up 20% from
approximately $5.9 billion in fiscal year 2005. Gross margin as a percentage of revenue for fiscal year 2006 was 23%
as compared with 22% for fiscal year 2005. The increase in gross margin as a percentage of revenue from fiscal year
2005 was primarily due to higher overall unit shipments and an increase mix of new higher-
margin products partially
offset by higher costs associated with new product transitions, increased warranty cost and customer service
inventory write-downs, stock-based compensation costs, price erosion, and in connection with the Maxtor
acquisition, an increasingly under-utilized manufacturing infrastructure required to build Maxtor-designed disc drive
products and purchase accounting related costs including integration and retention costs, stock-based compensation
and amortization of existing technology.
Product Development Expense. Product development expense increased by $160 million, or 25%, for fiscal
year 2006 when compared with fiscal year 2005. The increase in product development expense from fiscal year 2005
was primarily due to increases of $65 million in salaries resulting and benefits from increased staffing levels and
variable performance-based compensation, $38 million in product development support costs, $24 million in stock-
based compensation and $28 million in costs related to the Maxtor acquisition, including integration and retention
costs and stock-based compensation.
Marketing and Administrative Expense. Marketing and administrative expense increased by $141 million, or
46%, for fiscal year 2006 when compared with fiscal year 2005. The increase in marketing and administrative
expense from fiscal year 2005 was primarily due to increases of $54 million in salaries and benefits resulting from
46
•
Consumer
—
18.1 million, up from 16.7 million units in fiscal year 2005.
•
Mobile
—
12.5 million, up from 5.7 million units in fiscal year 2005.
•
Enterprise
—
14.3 million, up from 13.5 million units in fiscal year 2005.
•
Desktop
—
73.8 million, up from 62.2 million units in fiscal year 2005.