Salesforce.com 2004 Annual Report Download - page 82
Download and view the complete annual report
Please find page 82 of the 2004 Salesforce.com annual report below. You can navigate through the pages in the report by either clicking on the pages listed below, or by using the keyword search tool below to find specific information within the annual report.-
 1
1 -
2
-
3
-
4
-
5
-
6
-
7
-
8
-
9
-
10
-
11
-
12
-
13
-
14
-
15
-
16
-
17
-
18
-
19
-
20
-
21
-
22
-
23
-
24
-
25
-
26
-
27
-
28
-
29
-
30
-
31
-
32
-
33
-
34
-
35
-
36
-
37
-
38
-
39
-
40
-
41
-
42
-
43
-
44
-
45
-
46
-
47
-
48
-
49
-
50
-
51
-
52
-
53
-
54
-
55
-
56
-
57
-
58
-
59
-
60
-
61
-
62
-
63
-
64
-
65
-
66
-
67
-
68
-
69
-
70
-
71
-
 72
72 -
 73
73 -
 74
74 -
 75
75 -
 76
76 -
 77
77 -
 78
78 -
 79
79 -
 80
80 -
 81
81 -
 82
82 -
 83
83 -
 84
84 -
 85
85 -
 86
86 -
 87
87 -
 88
88 -
 89
89 -
 90
90 -
 91
91 -
 92
92 -
93
-
94
-
95
-
96
-
97
-
98
-
99
-
100
-
101
-
102
-
103
-
104
-
105
-
106
-
107
-
108
-
109
-
110
-
111
-
112
-
113
-
114
-
115
-
116
-
117
-
118
-
119
-
120
-
121
-
122
-
123
-
124
-
125
 |
 |
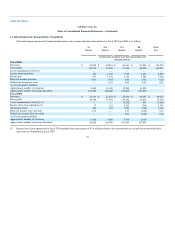
Table of Contents
salesforce.com, inc.
Notes to Consolidated Financial Statements—(Continued)
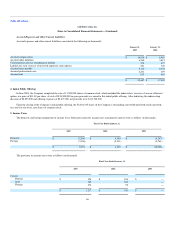
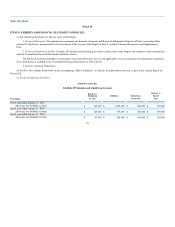
11. Selected Quarterly Financial Data (Unaudited)
Selected summarized quarterly financial information and customer and subscriber metrics for fiscal 2005 and 2004 is as follows:
1st
Quarter
2nd
Quarter
3rd
Quarter
4th
Quarter
Fiscal
Year
(in thousands, except per share data and customer and
subscriber metrics)
Fiscal 2005
Revenues $ 34,839 $ 40,581 $ 46,361 $ 54,594 $ 176,375
Gross profit 28,476 32,399 37,456 44,590 142,921
Lease abandonment (recovery) — — — — —
Income from operations 361 1,165 1,773 3,221 6,520
Net income 437 1,170 2,153 3,586 7,346
Basic net income per share 0.01 0.02 0.02 0.03 0.10
Diluted net income per share — 0.01 0.02 0.03 0.07
As of each quarter-end date:
Approximate number of customers 9,800 11,100 12,500 13,900
Approximate number of paying subscribers 147,000 168,000 195,000 227,000
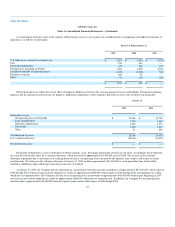
Fiscal 2004
Revenues $ 18,913 $ 21,623 $ 25,434 $ 30,053 $ 96,023
Gross profit 15,558 17,795 20,766 24,631 78,750
Lease abandonment (recovery) (1) — — (4,342) 897 (3,445)
Income (loss) from operations (1) 17 134 4,311 (744) 3,718
Net income (loss) 368 122 3,789 (765) 3,514
Basic net income (loss) per share 0.01 — 0.13 (0.02) 0.12
Diluted net income (loss) per share — — 0.04 (0.02) 0.04
As of each quarter-end date:
Approximate number of customers 6,300 7,000 7,700 8,700
Approximate number of paying subscribers 85,000 96,000 107,000 127,000
(1) Income (loss) from operations for fiscal 2004 included non-cash income of $3.4 million related to the net reduction in accruals associated with office
space that we abandoned in fiscal 2002.
75