Salesforce.com 2004 Annual Report Download - page 22
Download and view the complete annual report
Please find page 22 of the 2004 Salesforce.com annual report below. You can navigate through the pages in the report by either clicking on the pages listed below, or by using the keyword search tool below to find specific information within the annual report.-
 1
1 -
2
-
3
-
4
-
5
-
6
-
7
-
8
-
9
-
10
-
11
-
 12
12 -
 13
13 -
 14
14 -
 15
15 -
 16
16 -
 17
17 -
 18
18 -
 19
19 -
 20
20 -
 21
21 -
 22
22 -
 23
23 -
 24
24 -
 25
25 -
 26
26 -
 27
27 -
 28
28 -
 29
29 -
 30
30 -
 31
31 -
 32
32 -
33
-
34
-
35
-
36
-
37
-
38
-
39
-
40
-
41
-
42
-
43
-
44
-
45
-
46
-
47
-
48
-
49
-
50
-
51
-
52
-
53
-
54
-
55
-
56
-
57
-
58
-
59
-
60
-
61
-
62
-
63
-
64
-
65
-
66
-
67
-
68
-
69
-
70
-
71
-
72
-
73
-
74
-
75
-
76
-
77
-
78
-
79
-
80
-
81
-
82
-
83
-
84
-
85
-
86
-
87
-
88
-
89
-
90
-
91
-
92
-
93
-
94
-
95
-
96
-
97
-
98
-
99
-
100
-
101
-
102
-
103
-
104
-
105
-
106
-
107
-
108
-
109
-
110
-
111
-
112
-
113
-
114
-
115
-
116
-
117
-
118
-
119
-
120
-
121
-
122
-
123
-
124
-
125
 |
 |

Table of Contents
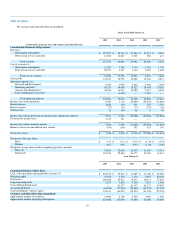
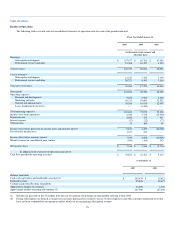
The customer and subscriber data are unaudited.
Fiscal Year Ended January 31,
(in thousands, except per share and customer and subscriber data)
2005
2004
2003
2002
2001
Consolidated Statement of Operations:
Revenues:
Subscription and support $ 157,977 $ 85,796 $ 47,656 $ 21,513 $ 5,022
Professional services and other 18,398 10,227 3,335 896 413
Total revenues 176,375 96,023 50,991 22,409 5,435
Cost of revenues (1):
Subscription and support 12,727 7,782 7,199 3,718 1,730
Professional services and other 20,727 9,491 3,164 2,329 1,692
Total cost of revenues 33,454 17,273 10,363 6,047 3,422
Gross profit 142,921 78,750 40,628 16,362 2,013
Operating expenses (1):
Research and development 9,822 6,962 4,648 5,308 3,366
Marketing and sales 96,311 54,600 33,522 24,605 25,392
General and administrative 30,268 16,915 12,958 8,317 6,855
Lease abandonment (recovery) — (3,445) — 7,657 —
Total operating expenses 136,401 75,032 51,128 45,887 35,613
Income (loss) from operations 6,520 3,718 (10,500) (29,525) (33,600)
Interest income 2,658 379 471 755 1,715
Interest expense (37) (22) (77) (272) (42)
Other income 12 164 98 8 63
Income (loss) before provision for income taxes and minority interest 9,153 4,239 (10,008) (29,034) (31,864)
Provision for income taxes 1,217 541 — — —
Income (loss) before minority interest 7,936 3,698 (10,008) (29,034) (31,864)
Minority interest in consolidated joint venture (590) (184) 292 425 193
Net income (loss) $ 7,346 $ 3,514 $ (9,716) $ (28,609) $ (31,671)
Net income (loss) per share:
Basic $ 0.10 $ 0.12 $ (0.37) $ (1.36) $ (2.38)
Diluted 0.07 0.04 (0.37) (1.36) (2.38)
Weighted-average shares used in computing per share amounts:
Basic (2) 75,503 29,605 26,375 21,039 13,314
Diluted (2) 110,874 95,409 26,375 21,039 13,314
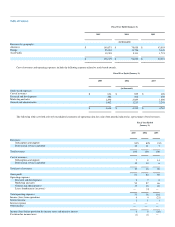
As of January 31,
2005
2004
2003
2002
2001
Consolidated Balance Sheet Data:
Cash, cash equivalents and marketable securities (3) $ 205,938 $ 35,812 $ 16,009 $ 11,709 $ 22,200
Working capital 47,044 4,140 1,172 6,497 20,163
Total assets 280,499 87,511 39,673 29,713 37,047
Long-term obligations 2,317 1,830 5,206 7,291 1,425
Convertible preferred stock — 61,137 61,137 61,137 59,852
Accumulated deficit (64,588) (71,934) (75,448) (65,732) (37,123)
Total stockholders' (deficit) equity 145,131 (46,237) (55,875) (51,348) (29,329)
Customer and Subscriber Data (unaudited):
Approximate number of customers 13,900 8,700 5,700 3,500 1,500
Approximate number of paying subscriptions 227,000 127,000 76,000 53,000 30,000
19