Salesforce.com 2004 Annual Report Download - page 28
Download and view the complete annual report
Please find page 28 of the 2004 Salesforce.com annual report below. You can navigate through the pages in the report by either clicking on the pages listed below, or by using the keyword search tool below to find specific information within the annual report.-
 1
1 -
2
-
3
-
4
-
5
-
6
-
7
-
8
-
9
-
10
-
11
-
12
-
13
-
14
-
15
-
16
-
17
-
 18
18 -
 19
19 -
 20
20 -
 21
21 -
 22
22 -
 23
23 -
 24
24 -
 25
25 -
 26
26 -
 27
27 -
 28
28 -
 29
29 -
 30
30 -
 31
31 -
 32
32 -
 33
33 -
 34
34 -
 35
35 -
 36
36 -
 37
37 -
 38
38 -
39
-
40
-
41
-
42
-
43
-
44
-
45
-
46
-
47
-
48
-
49
-
50
-
51
-
52
-
53
-
54
-
55
-
56
-
57
-
58
-
59
-
60
-
61
-
62
-
63
-
64
-
65
-
66
-
67
-
68
-
69
-
70
-
71
-
72
-
73
-
74
-
75
-
76
-
77
-
78
-
79
-
80
-
81
-
82
-
83
-
84
-
85
-
86
-
87
-
88
-
89
-
90
-
91
-
92
-
93
-
94
-
95
-
96
-
97
-
98
-
99
-
100
-
101
-
102
-
103
-
104
-
105
-
106
-
107
-
108
-
109
-
110
-
111
-
112
-
113
-
114
-
115
-
116
-
117
-
118
-
119
-
120
-
121
-
122
-
123
-
124
-
125
 |
 |

Table of Contents
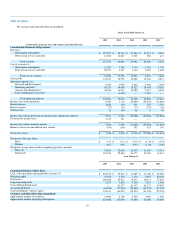
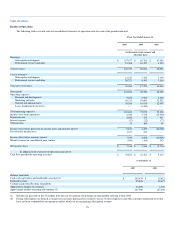
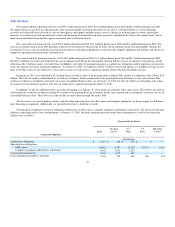
Results of Operations
The following tables set forth selected consolidated statements of operations data for each of the periods indicated.
Fiscal Year Ended January 31,
2005
2004
2003
(in thousands except customer and
subscriber data)
Revenues:
Subscription and support $ 157,977 $ 85,796 $ 47,656
Professional services and other 18,398 10,227 3,335
Total revenues 176,375 96,023 50,991
Cost of revenues:
Subscription and support 12,727 7,782 7,199
Professional services and other 20,727 9,491 3,164
Total cost of revenues 33,454 17,273 10,363
Gross profit 142,921 78,750 40,628
Operating expenses:
Research and development 9,822 6,962 4,648
Marketing and sales 96,311 54,600 33,522
General and administrative 30,268 16,915 12,958
Lease abandonment (recovery) — (3,445) —
Total operating expenses 136,401 75,032 51,128
Income (loss) from operations 6,520 3,718 (10,500)
Interest income 2,658 379 471
Interest expense (37) (22) (77)
Other income 12 164 98
Income (loss) before provision for income taxes and minority interest 9,153 4,239 (10,008)
Provision for income taxes 1,217 541 —
Income (loss) before minority interest 7,936 3,698 (10,008)
Minority interest in consolidated joint venture (590) (184) 292
Net income (loss) $ 7,346 $ 3,514 $ (9,716)
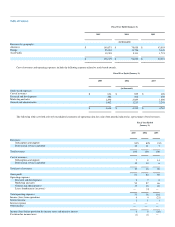
In addition to the statement of operations data above:
Cash flow provided by operating activities $ 55,872 $ 21,781 $ 5,213
As of January 31,
2005
2004
Balance sheet data:
Cash, cash equivalents and marketable securities (1) $ 205,938 $ 35,812
Deferred revenue 95,900 49,677
Customer and subscriber data (unaudited):
Approximate number of customers 13,900 8,700
Approximate number of paying subscriptions (2) 227,000 127,000
(1) Includes net proceeds of $113.8 million from the sale of common stock during our initial public offering in June 2004.
(2) Paying subscriptions are defined as unique user accounts, purchased by customers for use by their employees and other customer-authorized users that
have not been suspended for non-payment and for which we are recognizing subscription revenue.
25