Salesforce.com 2004 Annual Report Download - page 55
Download and view the complete annual report
Please find page 55 of the 2004 Salesforce.com annual report below. You can navigate through the pages in the report by either clicking on the pages listed below, or by using the keyword search tool below to find specific information within the annual report.-
 1
1 -
2
-
3
-
4
-
5
-
6
-
7
-
8
-
9
-
10
-
11
-
12
-
13
-
14
-
15
-
16
-
17
-
18
-
19
-
20
-
21
-
22
-
23
-
24
-
25
-
26
-
27
-
28
-
29
-
30
-
31
-
32
-
33
-
34
-
35
-
36
-
37
-
38
-
39
-
40
-
41
-
42
-
43
-
44
-
 45
45 -
 46
46 -
 47
47 -
 48
48 -
 49
49 -
 50
50 -
 51
51 -
 52
52 -
 53
53 -
 54
54 -
 55
55 -
 56
56 -
 57
57 -
 58
58 -
 59
59 -
 60
60 -
 61
61 -
 62
62 -
 63
63 -
 64
64 -
 65
65 -
66
-
67
-
68
-
69
-
70
-
71
-
72
-
73
-
74
-
75
-
76
-
77
-
78
-
79
-
80
-
81
-
82
-
83
-
84
-
85
-
86
-
87
-
88
-
89
-
90
-
91
-
92
-
93
-
94
-
95
-
96
-
97
-
98
-
99
-
100
-
101
-
102
-
103
-
104
-
105
-
106
-
107
-
108
-
109
-
110
-
111
-
112
-
113
-
114
-
115
-
116
-
117
-
118
-
119
-
120
-
121
-
122
-
123
-
124
-
125
 |
 |

Table of Contents
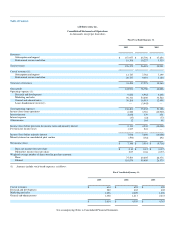
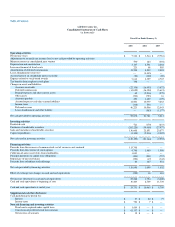
salesforce.com, inc.
Consolidated Statements of Operations
(in thousands, except per share data)
Fiscal Year Ended January 31,
2005
2004
2003
Revenues:
Subscription and support $ 157,977 $ 85,796 $ 47,656
Professional services and other 18,398 10,227 3,335
Total revenues 176,375 96,023 50,991
Cost of revenues (1):
Subscription and support 12,727 7,782 7,199
Professional services and other 20,727 9,491 3,164
Total cost of revenues 33,454 17,273 10,363
Gross profit 142,921 78,750 40,628
Operating expenses (1):
Research and development 9,822 6,962 4,648
Marketing and sales 96,311 54,600 33,522
General and administrative 30,268 16,915 12,958
Lease abandonment (recovery) — (3,445) —
Total operating expenses 136,401 75,032 51,128
Income (loss) from operations 6,520 3,718 (10,500)
Interest income 2,658 379 471
Interest expense (37) (22) (77)
Other income 12 164 98
Income (loss) before provision for income taxes and minority interest 9,153 4,239 (10,008)
Provision for income taxes 1,217 541 —
Income (loss) before minority interest 7,936 3,698 (10,008)
Minority interest in consolidated joint venture (590) (184) 292
Net income (loss) $ 7,346 $ 3,514 $ (9,716)
Basic net income (loss) per share $ 0.10 $ 0.12 $ (0.37)
Diluted net income (loss) per share 0.07 0.04 (0.37)
Weighted-average number of shares used in per share amounts:
Basic 75,503 29,605 26,375
Diluted 110,874 95,409 26,375
(1) Amounts include stock-based expenses, as follows:
Fiscal Year Ended January 31,
2005
2004
2003
Cost of revenues $ 634 $ 655 $ 428
Research and development 282 462 402
Marketing and sales 1,296 2,029 1,696
General and administrative 1,402 1,213 2,241
$ 3,614 $ 4,359 $ 4,767
See accompanying Notes to Consolidated Financial Statements.