Salesforce.com 2004 Annual Report Download - page 31
Download and view the complete annual report
Please find page 31 of the 2004 Salesforce.com annual report below. You can navigate through the pages in the report by either clicking on the pages listed below, or by using the keyword search tool below to find specific information within the annual report.-
 1
1 -
2
-
3
-
4
-
5
-
6
-
7
-
8
-
9
-
10
-
11
-
12
-
13
-
14
-
15
-
16
-
17
-
18
-
19
-
20
-
 21
21 -
 22
22 -
 23
23 -
 24
24 -
 25
25 -
 26
26 -
 27
27 -
 28
28 -
 29
29 -
 30
30 -
 31
31 -
 32
32 -
 33
33 -
 34
34 -
 35
35 -
 36
36 -
 37
37 -
 38
38 -
 39
39 -
 40
40 -
 41
41 -
42
-
43
-
44
-
45
-
46
-
47
-
48
-
49
-
50
-
51
-
52
-
53
-
54
-
55
-
56
-
57
-
58
-
59
-
60
-
61
-
62
-
63
-
64
-
65
-
66
-
67
-
68
-
69
-
70
-
71
-
72
-
73
-
74
-
75
-
76
-
77
-
78
-
79
-
80
-
81
-
82
-
83
-
84
-
85
-
86
-
87
-
88
-
89
-
90
-
91
-
92
-
93
-
94
-
95
-
96
-
97
-
98
-
99
-
100
-
101
-
102
-
103
-
104
-
105
-
106
-
107
-
108
-
109
-
110
-
111
-
112
-
113
-
114
-
115
-
116
-
117
-
118
-
119
-
120
-
121
-
122
-
123
-
124
-
125
 |
 |

Table of Contents
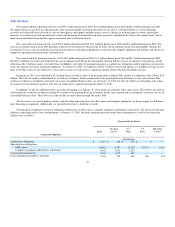
Fiscal Year Ended January 31,
2005
2004
2003
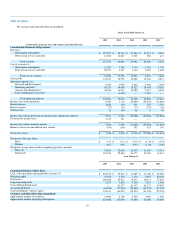
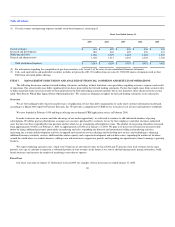
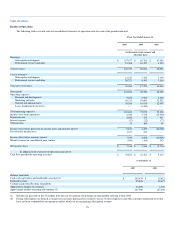
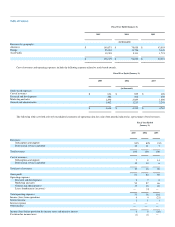
Revenues by geography:
Americas 80% 82% 86%
Europe 14 12 10
Asia Pacific 6 6 4
100% 100% 100%
Fiscal Year Ended January 31,
2005
2004
2003
Stock-based expenses:
Cost of revenues — % 1% 1%
Research and development — 1 1
Marketing and sales 1 2 3
General and administrative 1 1 4
2% 5% 9%
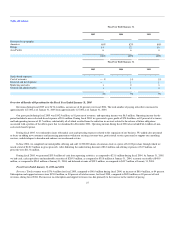
Overview of Results of Operations for the Fiscal Year Ended January 31, 2005
Revenues during fiscal 2005 were $176.4 million, an increase of 84 percent over fiscal 2004. The total number of paying subscribers increased to
approximately 227,000 as of January 31, 2005 from approximately 127,000 as of January 31, 2004.
Our gross profit during fiscal 2005 was $142.9 million, or 81 percent of revenues, and operating income was $6.5 million. Operating income for the
period included a non-cash stock-based expense of $3.6 million. During fiscal 2004, we generated a gross profit of $78.8 million, or 82 percent of revenues,
and had operating income of $3.7 million, substantially all of which resulted from the reduction in accruals related to the release of future obligations
associated with a portion of the office space that we abandoned in December 2001. Operating income during fiscal 2004 also included $4.4 million of non-
cash stock-based expense.
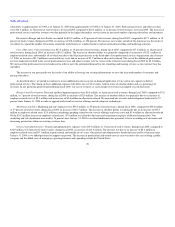
During fiscal 2005, we continued to incur substantial costs and operating expenses related to the expansion of our business. We added sales personnel
to focus on adding new customers and increasing penetration within our existing customer base, professional services personnel to support our consulting
services, and developers to broaden and enhance our on-demand service.
In June 2004, we completed our initial public offering and sold 11,500,000 shares of common stock at a price of $11.00 per share through which we
raised a total of $126.5 million in gross proceeds. After deducting the underwriting discount of $8.8 million and offering expenses of $3.9 million, net
proceeds were $113.8 million.
During fiscal 2005, we generated $55.9 million of cash from operating activities, as compared to $21.8 million during fiscal 2004. At January 31, 2005,
we had cash, cash equivalents and marketable securities of $205.9 million, as compared to $35.8 million at January 31, 2004, accounts receivable of $48.9
million, as compared to $26.5 million at January 31, 2004, and deferred revenue of $95.9 million, as compared to $49.7 million at January 31, 2004.
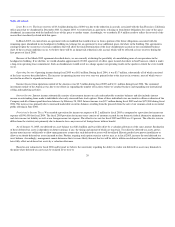
Fiscal Years Ended January 31, 2005 and 2004
Revenues. Total revenues were $176.4 million for fiscal 2005, compared to $96.0 million during fiscal 2004, an increase of $80.4 million, or 84 percent.
Subscription and support revenues were $158.0 million, or 90 percent of total revenues, for fiscal 2005, compared to $85.8 million, or 89 percent of total
revenues, during fiscal 2004. The increase in subscription and support revenues was due primarily to the increase in the number of paying
27