Salesforce.com 2004 Annual Report Download - page 74
Download and view the complete annual report
Please find page 74 of the 2004 Salesforce.com annual report below. You can navigate through the pages in the report by either clicking on the pages listed below, or by using the keyword search tool below to find specific information within the annual report.-
 1
1 -
2
-
3
-
4
-
5
-
6
-
7
-
8
-
9
-
10
-
11
-
12
-
13
-
14
-
15
-
16
-
17
-
18
-
19
-
20
-
21
-
22
-
23
-
24
-
25
-
26
-
27
-
28
-
29
-
30
-
31
-
32
-
33
-
34
-
35
-
36
-
37
-
38
-
39
-
40
-
41
-
42
-
43
-
44
-
45
-
46
-
47
-
48
-
49
-
50
-
51
-
52
-
53
-
54
-
55
-
56
-
57
-
58
-
59
-
60
-
61
-
62
-
63
-
 64
64 -
 65
65 -
 66
66 -
 67
67 -
 68
68 -
 69
69 -
 70
70 -
 71
71 -
 72
72 -
 73
73 -
 74
74 -
 75
75 -
 76
76 -
 77
77 -
 78
78 -
 79
79 -
 80
80 -
 81
81 -
 82
82 -
 83
83 -
 84
84 -
85
-
86
-
87
-
88
-
89
-
90
-
91
-
92
-
93
-
94
-
95
-
96
-
97
-
98
-
99
-
100
-
101
-
102
-
103
-
104
-
105
-
106
-
107
-
108
-
109
-
110
-
111
-
112
-
113
-
114
-
115
-
116
-
117
-
118
-
119
-
120
-
121
-
122
-
123
-
124
-
125
 |
 |
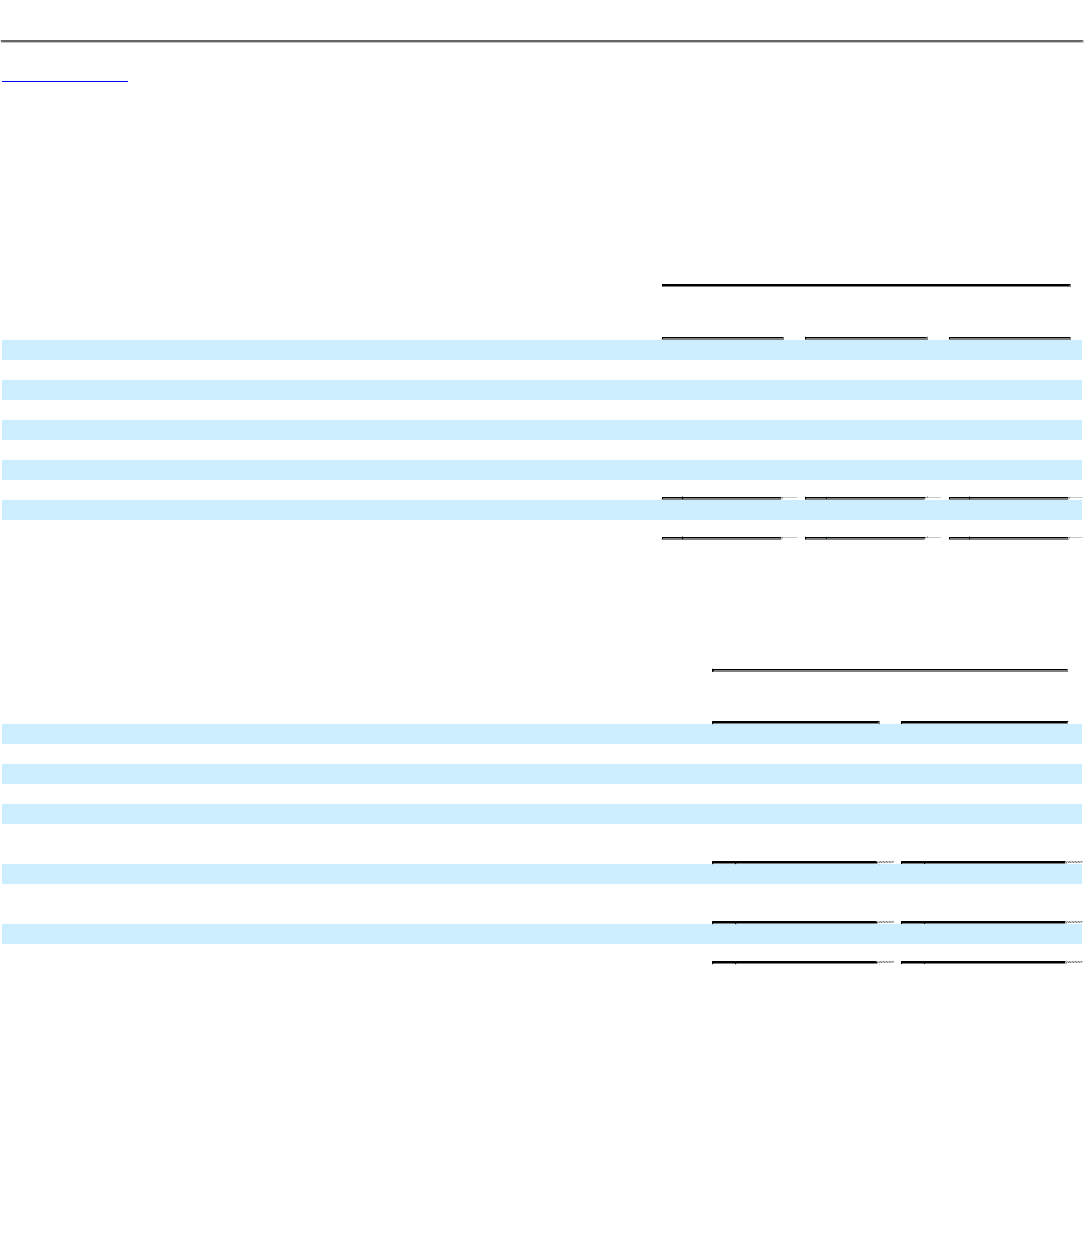
Table of Contents
salesforce.com, inc.
Notes to Consolidated Financial Statements—(Continued)
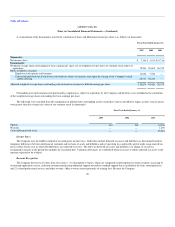
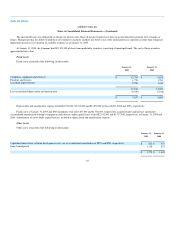
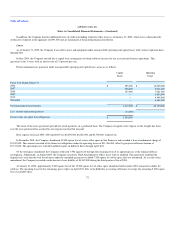
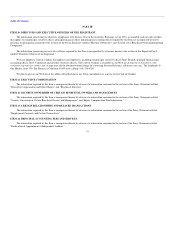
A reconciliation of income taxes at the statutory federal income tax rate to net income taxes included in the accompanying consolidated statements of
operations is as follows (in thousands):
Fiscal Year Ended January 31,
2005
2004
2003
U.S. federal taxes (benefit) at statutory rate $ 3,207 $ 1,484 $ (3,503)
State 189 263 —
Deferred compensation 347 802 697
Foreign losses providing no benefit 1,466 1,859 2,016
Unutilized (utilized) net operating losses (4,453) (4,068) 563
Foreign tax expense 290 92 —
Other 171 109 227
$ 1,217 $ 541 $ —
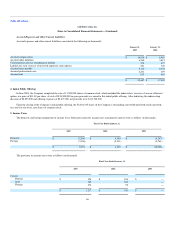
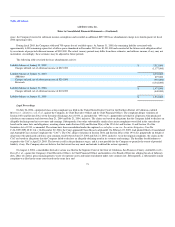
Deferred income taxes reflect the net tax effect of temporary differences between the carrying amounts of assets and liabilities for financial reporting
purposes and the amounts used for income tax purposes. Significant components of the Company's deferred tax assets were as follows (in thousands):
January 31,
2005
2004
Deferred tax assets:
Net operating loss carryforwards $ 22,968 $ 14,729
Lease abandonment 1,074 1,040
Deferred compensation 2,425 1,973
Tax credits 1,678 1,017
Other 51 920
Total deferred tax assets 28,196 19,679
Less valuation allowance (28,196) (19,679)
Net deferred tax assets $ — $ —
Realization of deferred tax assets is dependent on future earnings, if any, the timing and amount of which are uncertain. Accordingly, the net deferred
tax assets have been fully offset by a valuation allowance, which increased by approximately $8,500,000 in fiscal 2005. The increase in the valuation
allowance is primarily due to uncertainties of realizing domestic losses, net operating losses incurred by the Japanese joint venture, and certain tax credit
carryforwards. The balance in the valuation allowance of January 31, 2005 includes approximately $8,100,000 for stock plan deductions which will be
credited to additional capital and the provision for income taxes if realized.
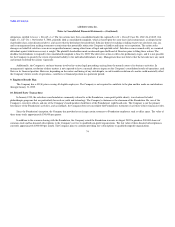
At January 31, 2005, the Company had net operating loss carryforwards for federal income tax purposes of approximately $43,300,000, which expire in
2020 through 2023, federal research and development tax credits of approximately $800,000, which expire in 2020 through 2023, and minimum tax credits,
which have no expiration date. The Company also has state net operating loss carryforwards of approximately $48,500,000 which expire beginning in 2007
and state research and development tax credits of approximately $800,000 which have no expiration date. In addition, the Company has net operating loss
carryforwards of approximately $3,400,000 from the Japanese joint venture which expire in 2006 though 2009.
67