Salesforce.com 2004 Annual Report Download - page 32
Download and view the complete annual report
Please find page 32 of the 2004 Salesforce.com annual report below. You can navigate through the pages in the report by either clicking on the pages listed below, or by using the keyword search tool below to find specific information within the annual report.-
 1
1 -
2
-
3
-
4
-
5
-
6
-
7
-
8
-
9
-
10
-
11
-
12
-
13
-
14
-
15
-
16
-
17
-
18
-
19
-
20
-
21
-
 22
22 -
 23
23 -
 24
24 -
 25
25 -
 26
26 -
 27
27 -
 28
28 -
 29
29 -
 30
30 -
 31
31 -
 32
32 -
 33
33 -
 34
34 -
 35
35 -
 36
36 -
 37
37 -
 38
38 -
 39
39 -
 40
40 -
 41
41 -
 42
42 -
43
-
44
-
45
-
46
-
47
-
48
-
49
-
50
-
51
-
52
-
53
-
54
-
55
-
56
-
57
-
58
-
59
-
60
-
61
-
62
-
63
-
64
-
65
-
66
-
67
-
68
-
69
-
70
-
71
-
72
-
73
-
74
-
75
-
76
-
77
-
78
-
79
-
80
-
81
-
82
-
83
-
84
-
85
-
86
-
87
-
88
-
89
-
90
-
91
-
92
-
93
-
94
-
95
-
96
-
97
-
98
-
99
-
100
-
101
-
102
-
103
-
104
-
105
-
106
-
107
-
108
-
109
-
110
-
111
-
112
-
113
-
114
-
115
-
116
-
117
-
118
-
119
-
120
-
121
-
122
-
123
-
124
-
125
 |
 |

Table of Contents
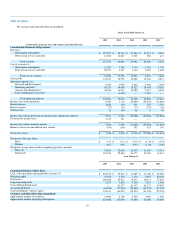
subscribers to approximately 227,000 as of January 31, 2005 from approximately 127,000 as of January 31, 2004. Professional services and other revenues
were $18.4 million, or 10 percent of total revenues, for fiscal 2005, compared to $10.2 million, or 11 percent of total revenues, for fiscal 2004. The increase in
professional services and other revenues was due primarily to the higher demand for services from an increased number of paying subscribers and customers.
Revenues in Europe and Asia Pacific accounted for $35.5 million, or 20 percent of total revenues, during fiscal 2005, compared to $17.1 million, or 18
percent of total revenues, during fiscal 2004, an increase of $18.4 million, or 108 percent. The increase in revenues outside of the Americas was the result of
our efforts to expand the number of locations around the world where we conduct business and our international selling and marketing activities.
Cost of Revenues. Cost of revenues was $33.5 million, or 19 percent of total revenues, during fiscal 2005, compared to $17.3 million, or 18 percent of
total revenues, during fiscal 2004, an increase of $16.2 million. The increase in absolute dollars was primarily comprised of an increase of $12.1 million in
employee-related costs, substantially all of which was due to the 80 percent increase in the headcount of our professional services organization since January
31, 2004, an increase of $1.9 million in service delivery costs and an increase of $1.7 million in allocated overhead. The cost of the additional professional
services headcount resulted in the cost of professional services and other revenues to be in excess of the related revenue during fiscal 2005 by $2.3 million.
We increased the professional services headcount in order to meet the anticipated demand for our consulting and training services as our customer base has
expanded.
The increase in our gross profit was the result of our ability to leverage our existing infrastructure to serve the increased number of customers and
paying subscribers.
As described above, we intend to continue to invest additional resources in our on-demand application service and in our capacity to deliver
professional services. The timing of these additional expenses will affect our cost of revenues, both in terms of absolute dollars and as a percentage of
revenues. In any particular quarterly period during fiscal 2006, our cost of revenues as a percentage of revenues may slightly exceed 20 percent.
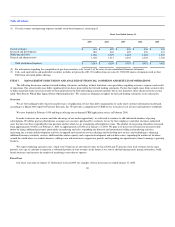
Research and Development. Research and development expenses were $9.8 million, or 5 percent of total revenues, during fiscal 2005, compared to $7.0
million, or 7 percent of total revenues, during fiscal 2004, an increase of $2.8 million. The increase in absolute dollars was primarily due to an increase in
employee-related costs of $2.3 million and an increase of $0.4 million in allocated overhead. We increased our research and development headcount by 57
percent since January 31, 2004 in order to upgrade and extend our service offerings and develop new technologies.
Marketing and Sales. Marketing and sales expenses were $96.3 million, or 55 percent of total revenues, during fiscal 2005, compared to $54.6 million,
or 57 percent of total revenues, during fiscal 2004, an increase of $41.7 million. The increase in absolute dollars was primarily due to an increase of $34.3
million in employee-related costs, $3.5 million in marketing spending related to new service offerings and event costs and $3.4 million in allocated overhead.
Of the $34.3 million increase in employee-related costs, $7.0 million was related to the increased amortization expense of deferred commissions. Our
marketing and sales headcount increased by 76 percent since January 31, 2004 as we hired additional sales personnel to focus on adding new customers and
increasing penetration within our existing customer base.
General and Administrative. General and administrative expenses were $30.3 million, or 17 percent of total revenues, during fiscal 2005, compared to
$16.9 million, or 18 percent of total revenues, during fiscal 2004, an increase of $13.4 million. The increase was due to an increase of $8.3 million in
employee-related costs and $5.1 million in professional and outside service costs. Our general and administrative headcount increased by 64 percent since
January 31, 2004 as we added personnel to support our growth. The increase in professional and outside service costs was due to the cost of being a public
company and the added costs of managing a growing business and expanding outside the United States.
28