Salesforce.com 2004 Annual Report Download - page 36
Download and view the complete annual report
Please find page 36 of the 2004 Salesforce.com annual report below. You can navigate through the pages in the report by either clicking on the pages listed below, or by using the keyword search tool below to find specific information within the annual report.-
 1
1 -
2
-
3
-
4
-
5
-
6
-
7
-
8
-
9
-
10
-
11
-
12
-
13
-
14
-
15
-
16
-
17
-
18
-
19
-
20
-
21
-
22
-
23
-
24
-
25
-
 26
26 -
 27
27 -
 28
28 -
 29
29 -
 30
30 -
 31
31 -
 32
32 -
 33
33 -
 34
34 -
 35
35 -
 36
36 -
 37
37 -
 38
38 -
 39
39 -
 40
40 -
 41
41 -
 42
42 -
 43
43 -
 44
44 -
 45
45 -
 46
46 -
47
-
48
-
49
-
50
-
51
-
52
-
53
-
54
-
55
-
56
-
57
-
58
-
59
-
60
-
61
-
62
-
63
-
64
-
65
-
66
-
67
-
68
-
69
-
70
-
71
-
72
-
73
-
74
-
75
-
76
-
77
-
78
-
79
-
80
-
81
-
82
-
83
-
84
-
85
-
86
-
87
-
88
-
89
-
90
-
91
-
92
-
93
-
94
-
95
-
96
-
97
-
98
-
99
-
100
-
101
-
102
-
103
-
104
-
105
-
106
-
107
-
108
-
109
-
110
-
111
-
112
-
113
-
114
-
115
-
116
-
117
-
118
-
119
-
120
-
121
-
122
-
123
-
124
-
125
 |
 |
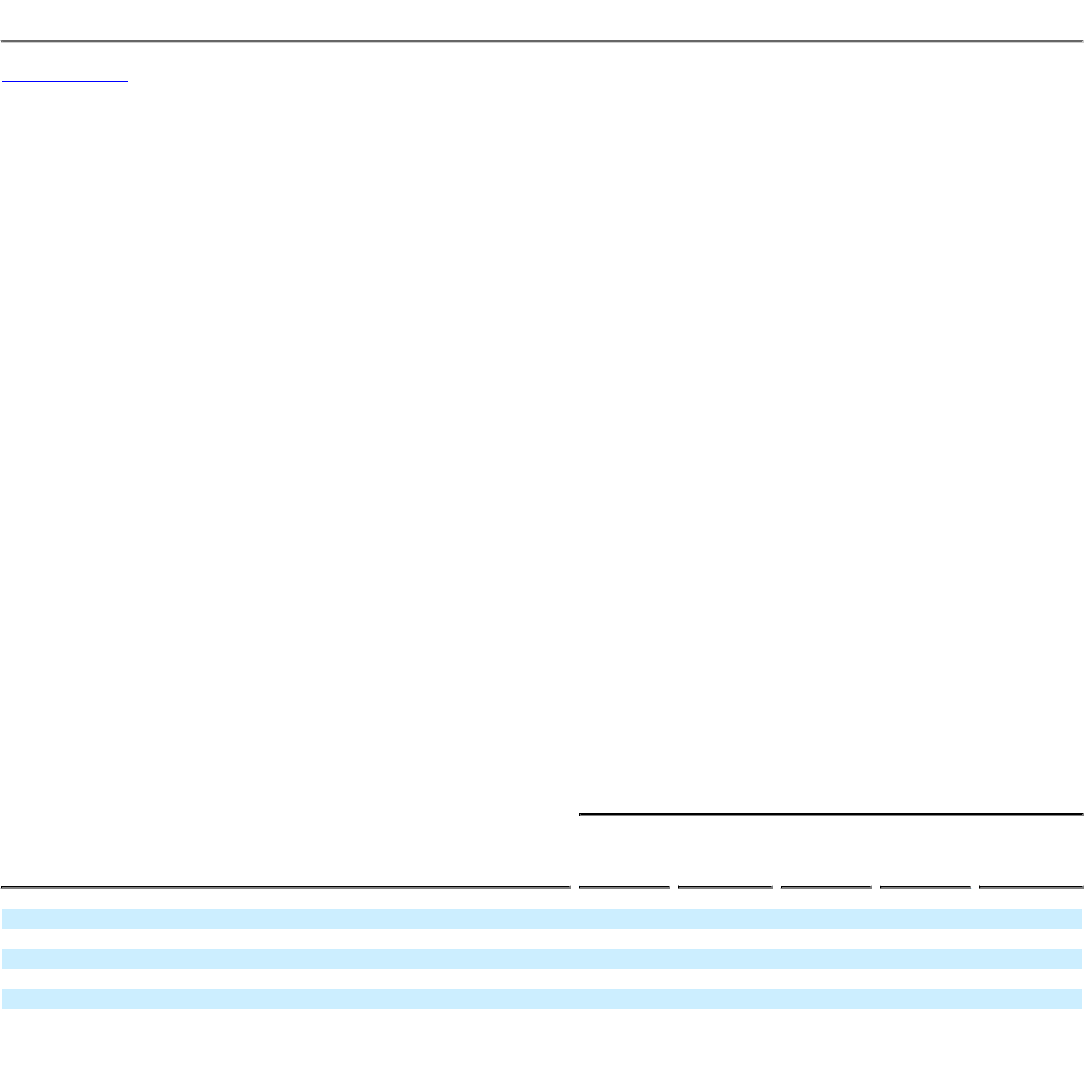
Table of Contents
Net cash provided by operating activities was $55.9 million during fiscal 2005, $21.8 million during fiscal 2004 and $5.2 million during fiscal 2003.
The improvement in cash flow was due primarily to the increased number of paying subscribers to our service. Cash provided by or used in operating
activities has historically been affected by sales of subscriptions and support and professional services, changes in working capital accounts, particularly
increases in accounts receivable and deferred revenue and the timing of commission and bonus payments, and add-backs of non-cash expense items such as
depreciation and amortization and the expense associated with stock-based awards.
Net cash used in investing activities was $149.2 million during fiscal 2005, $21.1 million during fiscal 2004 and $9.6 million during fiscal 2003. The
increase in amounts used in fiscal 2005 primarily related to the investment of the proceeds from the sale of common stock in our initial public offering, the
investment of excess cash, the reduction in restricted cash balances and capital expenditures associated with computer equipment and furniture and fixtures in
support of expanding our infrastructure and work force.
Net cash provided by financing activities was $118.9 million during fiscal 2005, $1.1 million during fiscal 2004 and $1.0 million during fiscal 2003.
The $118.5 million of net proceeds from both the sale of common stock during the initial public offering and the exercise of employee stock options and the
collection of $1.0 million in notes receivable from stockholders were offset by principal payments on capital lease obligations and the repurchase of unvested
shares of common stock from terminated employees. At January 31, 2005, our employees held 4.7 million vested stock options at a weighted average exercise
price of $1.88 per share. If our employees exercise these awards, we will receive a significant amount of proceeds from the option exercises.
During fiscal 2001, we established a $3.5 million letter of credit in favor of our principal office landlord. This amount was reduced in June 2004 to $2.8
million. This letter of credit is collateralized by a certificate of deposit, which is maintained at the granting financial institution, for the same amount. This
certificate of deposit is included as restricted cash on our consolidated balance sheet. As of January 31, 2005, the letter of credit was outstanding and, to date,
no amounts have been drawn against it. The letter of credit renews annually through December 31, 2010.
In addition, we had two additional letters of credit outstanding as of January 31, 2005, which are related to office space leases. These letters of credit are
collateralized by certificates of deposit totaling $0.4 million at the granting financial institution, for the same amount and are included as restricted cash on our
consolidated balance sheet. These letters of credit are due at various dates through December 2008.
We do not have any special purpose entities, and other than operating leases for office space and computer equipment, we do not engage in off-balance
sheet financing arrangements. Additionally, we currently do not have a bank line of credit.
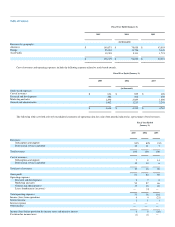
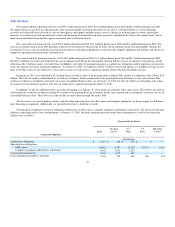
Our principal commitments consist of obligations under leases for office space, computer equipment and furniture and fixtures. We also have long-term
liabilities related primarily to lease abandonments. At January 31, 2005, the future minimum payments under these commitments as well as our long-term
liability were as follows:
Payments Due by Period
Contractual Obligations
Total
Less than
1 Year
1-3
Years
3-5
Years
More than
5 Years
(in thousands)
Capital lease obligations $ 1,317 $ 585 $ 732 $ — $ —
Operating lease obligations:
Office space 38,691 8,367 13,232 10,731 6,361
Computer equipment and furniture and fixtures 6,442 3,642 2,800 — —
Contractual commitments 2,390 1,572 818 — —
Lease abandonment liabilities and other 1,874 278 466 486 644
32