Salesforce.com 2004 Annual Report Download - page 29
Download and view the complete annual report
Please find page 29 of the 2004 Salesforce.com annual report below. You can navigate through the pages in the report by either clicking on the pages listed below, or by using the keyword search tool below to find specific information within the annual report.-
 1
1 -
2
-
3
-
4
-
5
-
6
-
7
-
8
-
9
-
10
-
11
-
12
-
13
-
14
-
15
-
16
-
17
-
18
-
 19
19 -
 20
20 -
 21
21 -
 22
22 -
 23
23 -
 24
24 -
 25
25 -
 26
26 -
 27
27 -
 28
28 -
 29
29 -
 30
30 -
 31
31 -
 32
32 -
 33
33 -
 34
34 -
 35
35 -
 36
36 -
 37
37 -
 38
38 -
 39
39 -
40
-
41
-
42
-
43
-
44
-
45
-
46
-
47
-
48
-
49
-
50
-
51
-
52
-
53
-
54
-
55
-
56
-
57
-
58
-
59
-
60
-
61
-
62
-
63
-
64
-
65
-
66
-
67
-
68
-
69
-
70
-
71
-
72
-
73
-
74
-
75
-
76
-
77
-
78
-
79
-
80
-
81
-
82
-
83
-
84
-
85
-
86
-
87
-
88
-
89
-
90
-
91
-
92
-
93
-
94
-
95
-
96
-
97
-
98
-
99
-
100
-
101
-
102
-
103
-
104
-
105
-
106
-
107
-
108
-
109
-
110
-
111
-
112
-
113
-
114
-
115
-
116
-
117
-
118
-
119
-
120
-
121
-
122
-
123
-
124
-
125
 |
 |
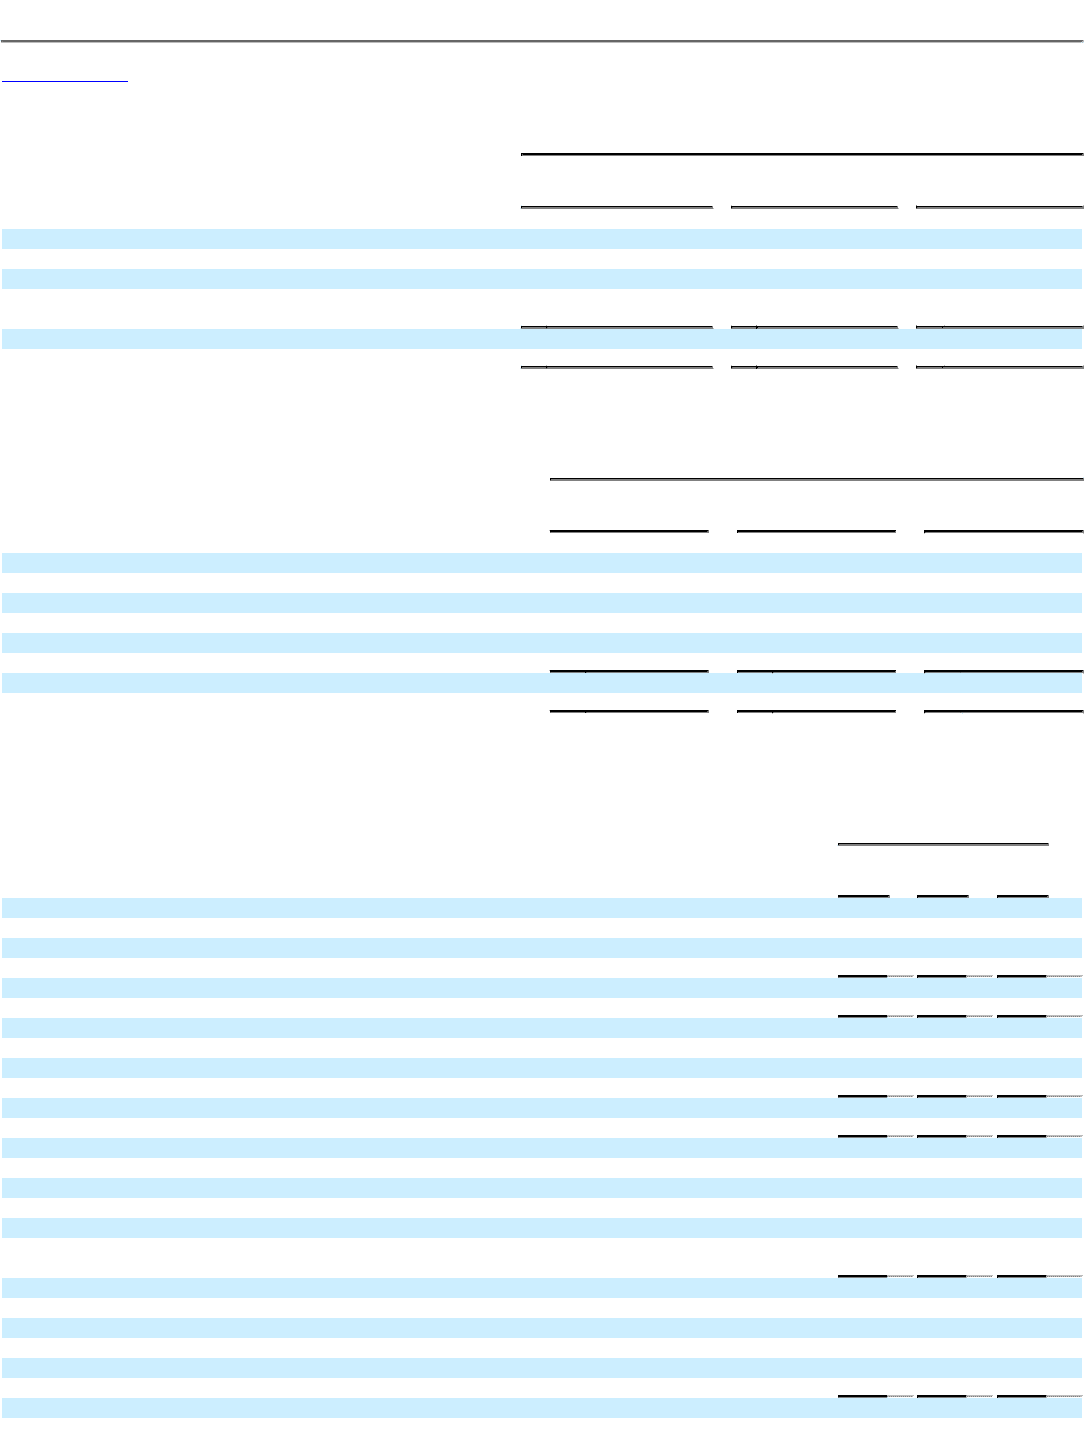
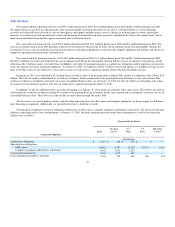
Table of Contents
Fiscal Year Ended January 31,
2005
2004
2003
(in thousands)
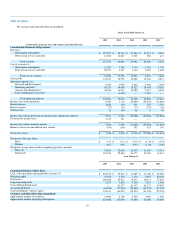
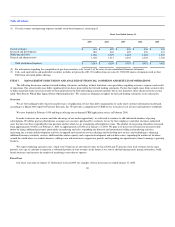
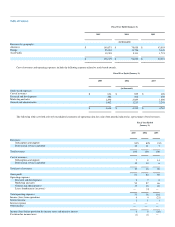
Revenues by geography:
Americas $ 140,871 $ 78,958 $ 43,855
Europe 25,201 11,754 5,345
Asia Pacific 10,303 5,311 1,791
$ 176,375 $ 96,023 $ 50,991
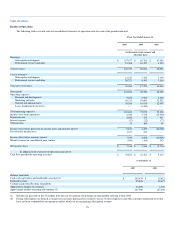
Cost of revenues and operating expenses include the following amounts related to stock-based awards.
Fiscal Year Ended January 31,
2005
2004
2003
(in thousands)
Stock-based expenses:
Cost of revenues $ 634 $ 655 $ 428
Research and development 282 462 402
Marketing and sales 1,296 2,029 1,696
General and administrative 1,402 1,213 2,241
$ 3,614 $ 4,359 $ 4,767
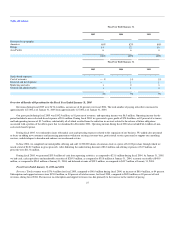
The following tables set forth selected consolidated statements of operations data for each of the periods indicated as a percentage of total revenues.
Fiscal Year Ended
January 31,
2005
2004
2003
Revenues:
Subscription and support 90% 89% 93%
Professional services and other 10 11 7
Total revenues 100 100 100
Cost of revenues:
Subscription and support 7 8 14
Professional services and other 12 10 6
Total cost of revenues 19 18 20
Gross profit 81 82 80
Operating expenses:
Research and development 5 7 9
Marketing and sales 55 57 66
General and administrative 17 18 26
Lease abandonment (recovery) — (4) —
Total operating expenses 77 78 101
Income (loss) from operations 4 4 (21)
Interest income 1 1 1
Interest expense — — —
Other income — — —
Income (loss) before provision for income taxes and minority interest 5 5 (20)
Provision for income taxes (1) (1) —