Salesforce.com 2004 Annual Report Download - page 60
Download and view the complete annual report
Please find page 60 of the 2004 Salesforce.com annual report below. You can navigate through the pages in the report by either clicking on the pages listed below, or by using the keyword search tool below to find specific information within the annual report.-
 1
1 -
2
-
3
-
4
-
5
-
6
-
7
-
8
-
9
-
10
-
11
-
12
-
13
-
14
-
15
-
16
-
17
-
18
-
19
-
20
-
21
-
22
-
23
-
24
-
25
-
26
-
27
-
28
-
29
-
30
-
31
-
32
-
33
-
34
-
35
-
36
-
37
-
38
-
39
-
40
-
41
-
42
-
43
-
44
-
45
-
46
-
47
-
48
-
49
-
 50
50 -
 51
51 -
 52
52 -
 53
53 -
 54
54 -
 55
55 -
 56
56 -
 57
57 -
 58
58 -
 59
59 -
 60
60 -
 61
61 -
 62
62 -
 63
63 -
 64
64 -
 65
65 -
 66
66 -
 67
67 -
 68
68 -
 69
69 -
 70
70 -
71
-
72
-
73
-
74
-
75
-
76
-
77
-
78
-
79
-
80
-
81
-
82
-
83
-
84
-
85
-
86
-
87
-
88
-
89
-
90
-
91
-
92
-
93
-
94
-
95
-
96
-
97
-
98
-
99
-
100
-
101
-
102
-
103
-
104
-
105
-
106
-
107
-
108
-
109
-
110
-
111
-
112
-
113
-
114
-
115
-
116
-
117
-
118
-
119
-
120
-
121
-
122
-
123
-
124
-
125
 |
 |
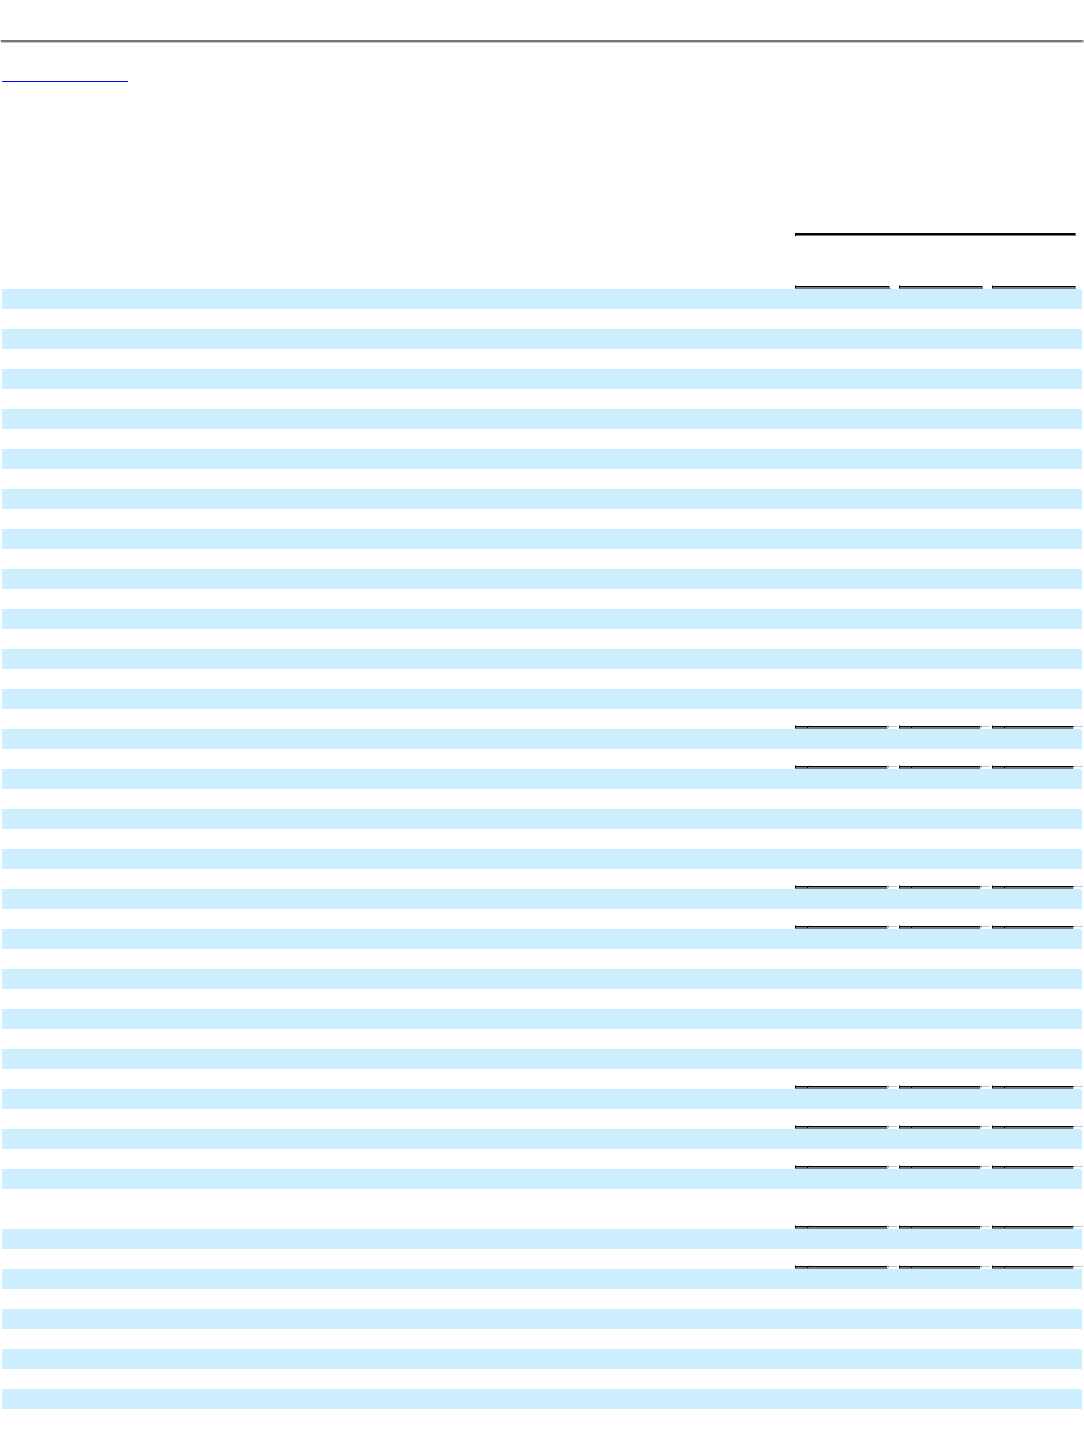
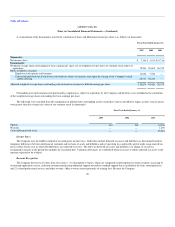
Table of Contents
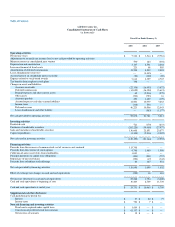
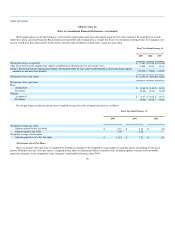
salesforce.com. inc.
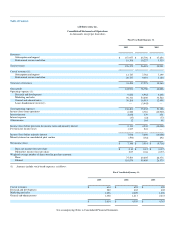
Consolidated Statements of Cash Flows
(in thousands)
Fiscal Year Ended January 31,
2005
2004
2003
Operating activities
Net income (loss) $ 7,346 $ 3,514 $ (9,716)
Adjustments to reconcile net income (loss) to net cash provided by operating activities:
Minority interest in consolidated joint venture 590 184 (292)
Depreciation and amortization 3,147 2,591 2,664
Loss on retirement of fixed assets 223 68 589
Amortization of deferred commissions 15,598 8,599 2,885
Lease abandonment (recovery) — (3,445) —
Accrued interest on stockholder notes receivable (96) (100) (89)
Expense related to stock-based awards 3,614 4,359 4,767
Tax benefits from employee stock plans 798 — —
Changes in assets and liabilities:
Accounts receivable (22,338) (16,955) (3,872)
Deferred commissions (14,055) (16,320) (5,691)
Prepaid expenses and other current assets 65 (2,216) (579)
Other assets (216) (723) 16
Accounts payable 490 1,429 (199)
Accrued expenses and other current liabilities 14,801 10,339 3,864
Income taxes (318) 534 —
Deferred revenue 46,223 30,506 12,043
Lease abandonment and other liability — (583) (1,177)
Net cash provided by operating activities 55,872 21,781 5,213
Investing activities
Restricted cash 721 (179) (233)
Purchases of marketable securities (282,220) (39,900) (27,977)
Sales and maturities of marketable securities 136,608 21,851 20,677
Capital expenditures (4,308) (2,916) (2,022)
Net cash used in investing activities (149,199) (21,144) (9,555)
Financing activities
Proceeds from the issuance of common stock, net of issuance costs incurred 113,768 — —
Proceeds from the exercise of stock options 4,746 1,480 1,580
Collection of notes receivables from stockholders 1,043 — —
Principal payments on capital lease obligations (493) (531) (757)
Repurchase of unvested shares (254) (17) (342)
Proceeds from subsidiary stock offerings 40 167 551
Net cash provided by financing activities 118,850 1,099 1,032
Effect of exchange rate changes on cash and cash equivalents (255) 18 310
Net increase (decrease) in cash and cash equivalents 25,268 1,754 (3,000)
Cash and cash equivalents at beginning of year 10,463 8,709 11,709
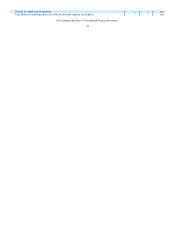
Cash and cash equivalents at end of year $ 35,731 $ 10,463 $ 8,709
Supplemental cash flow disclosure:
Cash paid during the period for:
Interest $ 37 $ 22 $ 77
Income taxes $ 730 $ 7 $ —
Noncash financing and investing activities
Fixed assets acquired under capital lease $ 1,699 $ — $ —
Conversion of preferred stock into common $ 61,137 $ — $ —
Net exercise of warrants $ 15 $ — $ —