Salesforce.com 2004 Annual Report Download - page 66
Download and view the complete annual report
Please find page 66 of the 2004 Salesforce.com annual report below. You can navigate through the pages in the report by either clicking on the pages listed below, or by using the keyword search tool below to find specific information within the annual report.-
 1
1 -
2
-
3
-
4
-
5
-
6
-
7
-
8
-
9
-
10
-
11
-
12
-
13
-
14
-
15
-
16
-
17
-
18
-
19
-
20
-
21
-
22
-
23
-
24
-
25
-
26
-
27
-
28
-
29
-
30
-
31
-
32
-
33
-
34
-
35
-
36
-
37
-
38
-
39
-
40
-
41
-
42
-
43
-
44
-
45
-
46
-
47
-
48
-
49
-
50
-
51
-
52
-
53
-
54
-
55
-
 56
56 -
 57
57 -
 58
58 -
 59
59 -
 60
60 -
 61
61 -
 62
62 -
 63
63 -
 64
64 -
 65
65 -
 66
66 -
 67
67 -
 68
68 -
 69
69 -
 70
70 -
 71
71 -
 72
72 -
 73
73 -
 74
74 -
 75
75 -
 76
76 -
77
-
78
-
79
-
80
-
81
-
82
-
83
-
84
-
85
-
86
-
87
-
88
-
89
-
90
-
91
-
92
-
93
-
94
-
95
-
96
-
97
-
98
-
99
-
100
-
101
-
102
-
103
-
104
-
105
-
106
-
107
-
108
-
109
-
110
-
111
-
112
-
113
-
114
-
115
-
116
-
117
-
118
-
119
-
120
-
121
-
122
-
123
-
124
-
125
 |
 |
Table of Contents
salesforce.com, inc.
Notes to Consolidated Financial Statements—(Continued)
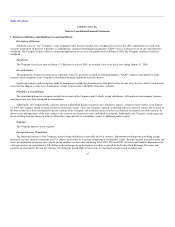
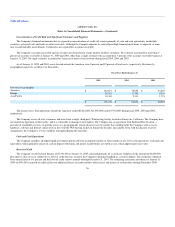
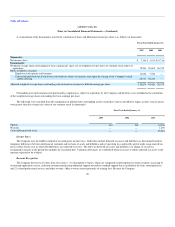
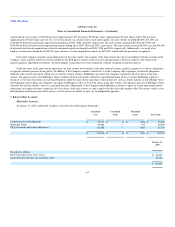
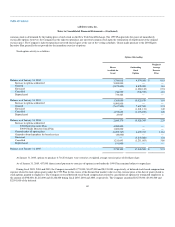
Had compensation cost for the Company's stock-based compensation plans been determined using the fair-value method at the grant date for awards
under those plans calculated using the Black-Scholes pricing model and recognized on a straight-line basis over the option vesting periods, the Company's net
income would have been decreased to the pro forma amounts indicated below (in thousands, except per share data):
Fiscal Year Ended January 31,
2005
2004
2003
Net income (loss), as reported $ 7,346 $ 3,514 $ (9,716)
Add: Total stock-based compensation expense included in the determination of net income (loss) 3,298 3,765 3,135
Deduct: Total stock-based compensation expense determined under the fair-value-based method for all awards. Such expense
amounts are not net of tax benefits. (13,901) (7,884) (4,805)
Net income (loss), pro forma $ (3,257) $ (605) $(11,386)
Net income (loss), per share:
Basic
As reported $ 0.10 $ 0.12 $ (0.37)
Pro forma (0.04) (0.02) (0.43)
Diluted:
As reported $ 0.07 $ 0.04 $ (0.37)
Pro forma (0.04) (0.02) (0.43)
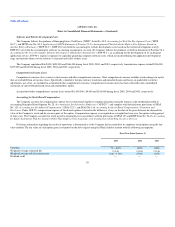
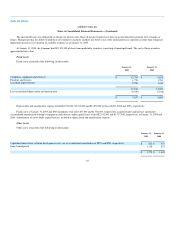
For the pro forma calculation, the per share weighted-average fair value of options granted are as follows:
Fiscal Year Ended January 31,
2005
2004
2003
Weighted-average fair value:
Options granted below fair value $ 6.51 $ 2.69 $ 1.65
Options equal to fair value 7.59 3.65 —
Weighted-average exercise price:
Options granted at or below fair value $ 11.61 $ 3.74 $ 1.10
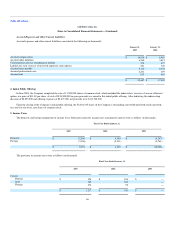
Net Income (Loss) Per Share
Basic net income (loss) per share is computed by dividing net income by the weighted-average number of common shares outstanding for the fiscal
period. Diluted net income (loss) per share is computed giving effect to all potential dilutive common stock, including options, warrants and convertible
preferred stock prior to the completion of the Company's initial public offering in June 2004.
59