Salesforce.com 2004 Annual Report Download - page 35
Download and view the complete annual report
Please find page 35 of the 2004 Salesforce.com annual report below. You can navigate through the pages in the report by either clicking on the pages listed below, or by using the keyword search tool below to find specific information within the annual report.-
 1
1 -
2
-
3
-
4
-
5
-
6
-
7
-
8
-
9
-
10
-
11
-
12
-
13
-
14
-
15
-
16
-
17
-
18
-
19
-
20
-
21
-
22
-
23
-
24
-
 25
25 -
 26
26 -
 27
27 -
 28
28 -
 29
29 -
 30
30 -
 31
31 -
 32
32 -
 33
33 -
 34
34 -
 35
35 -
 36
36 -
 37
37 -
 38
38 -
 39
39 -
 40
40 -
 41
41 -
 42
42 -
 43
43 -
 44
44 -
 45
45 -
46
-
47
-
48
-
49
-
50
-
51
-
52
-
53
-
54
-
55
-
56
-
57
-
58
-
59
-
60
-
61
-
62
-
63
-
64
-
65
-
66
-
67
-
68
-
69
-
70
-
71
-
72
-
73
-
74
-
75
-
76
-
77
-
78
-
79
-
80
-
81
-
82
-
83
-
84
-
85
-
86
-
87
-
88
-
89
-
90
-
91
-
92
-
93
-
94
-
95
-
96
-
97
-
98
-
99
-
100
-
101
-
102
-
103
-
104
-
105
-
106
-
107
-
108
-
109
-
110
-
111
-
112
-
113
-
114
-
115
-
116
-
117
-
118
-
119
-
120
-
121
-
122
-
123
-
124
-
125
 |
 |

Table of Contents
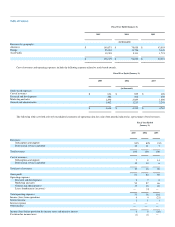
overhead. Of the $18.0 million in increased employee-related costs, $6.6 million was related to sales commissions. Our marketing and sales headcount
increased by 42 percent from fiscal 2003 as we hired additional sales personnel to focus on adding new customers and increasing penetration within our
existing customer base.
General and Administrative. General and administrative expenses were $16.9 million, or 18 percent of total revenues, during fiscal 2004, compared to
$13.0 million, or 26 percent of total revenues, during fiscal 2003, an increase of $3.9 million. The increase was primarily due to an increase of $3.0 million in
employee-related costs and an increase of $900,000 in professional and outside service costs. Our general and administrative headcount increased by 29
percent from fiscal 2003 as we added personnel to support our growth.
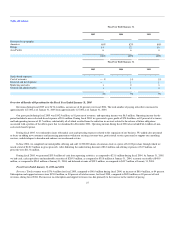
Lease Recovery. In December 2001, we abandoned excess office space in San Francisco, California and recorded a $7.7 million charge in the fourth
quarter of fiscal 2002 pertaining to the estimated future net obligations under the non-cancelable lease. Since the space was not leased to a subtenant, there
were no immediate cash savings from the abandonment.
In August 2003, we entered into an agreement, releasing us from future obligations for some of the space abandoned, in connection with the landlord's
lease of this space to another tenant. Accordingly, we recorded a $4.3 million credit to reflect the reversal of the remaining accrued liability that was directly
associated with this space. During the fourth quarter of fiscal 2004, we recorded an additional accrual of $900,000 related to the remaining 5,000 square feet
of abandoned office space in San Francisco. This additional accrual resulted from a revision of our estimates of the timing and amount of projected subtenant
income based on difficulties in subleasing the remaining space.
Operating Income (Loss). Operating income during fiscal 2004 was $3.7 million and included the $3.4 million lease recovery described above. The
operating loss during fiscal 2003 was $10.5 million. The increase in operating income was primarily due to a $45.0 million increase in revenues, most of
which was re-invested in an effort to expand our business.
Loss from operations outside of the Americas was $1.1 million during fiscal 2004 and was $3.8 million during fiscal 2003. The continued losses outside
of the Americas were due to our efforts in expanding the number of locations where we conduct business and expanding our international selling and
marketing activities.
Interest Income. Interest income consists of investment income on cash and marketable securities balances and interest income on outstanding loans
made to individuals who early exercised their stock options. Interest income was $379,000 during fiscal 2004, compared to $471,000 during fiscal 2003, a
decrease of $92,000. The decrease was primarily due to declining interest rates and the mix of marketable securities investments, substantially offset by higher
cash and marketable securities balances.
Provision for Income Taxes. The provision for income taxes of $541,000 during fiscal 2004 represented federal alternative minimum taxes of
approximately $200,000, and various state income taxes and foreign withholding taxes of approximately $300,000. Our effective tax rate for fiscal 2004 was
13 percent as compared to zero for fiscal 2003. The effective tax rate differs from the statutory rate primarily due to domestic loss carryovers net of foreign
losses with no benefit.
Our deferred tax asset balance at January 31, 2004 was $19.7 million and was fully offset by a valuation allowance of the same amount due to
uncertainties regarding realization of the deferred tax asset balance.
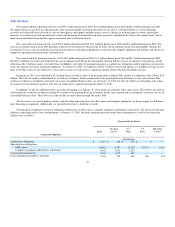
Liquidity and Capital Resources
At January 31, 2005, our principal sources of liquidity were cash, cash equivalents and marketable securities totaling $205.9 million, accounts
receivable of $48.9 million and cash flow provided by operating activities in fiscal 2005 of $55.9 million.
In June 2004, we completed the sale of 11,500,000 shares of common stock in an initial public offering, including the underwriters' exercise of an over-
allotment option, and realized net proceeds of $113.8 million. To date, we have not spent any of the proceeds from the initial public offering.
31