Salesforce.com 2004 Annual Report Download - page 34
Download and view the complete annual report
Please find page 34 of the 2004 Salesforce.com annual report below. You can navigate through the pages in the report by either clicking on the pages listed below, or by using the keyword search tool below to find specific information within the annual report.-
 1
1 -
2
-
3
-
4
-
5
-
6
-
7
-
8
-
9
-
10
-
11
-
12
-
13
-
14
-
15
-
16
-
17
-
18
-
19
-
20
-
21
-
22
-
23
-
 24
24 -
 25
25 -
 26
26 -
 27
27 -
 28
28 -
 29
29 -
 30
30 -
 31
31 -
 32
32 -
 33
33 -
 34
34 -
 35
35 -
 36
36 -
 37
37 -
 38
38 -
 39
39 -
 40
40 -
 41
41 -
 42
42 -
 43
43 -
 44
44 -
45
-
46
-
47
-
48
-
49
-
50
-
51
-
52
-
53
-
54
-
55
-
56
-
57
-
58
-
59
-
60
-
61
-
62
-
63
-
64
-
65
-
66
-
67
-
68
-
69
-
70
-
71
-
72
-
73
-
74
-
75
-
76
-
77
-
78
-
79
-
80
-
81
-
82
-
83
-
84
-
85
-
86
-
87
-
88
-
89
-
90
-
91
-
92
-
93
-
94
-
95
-
96
-
97
-
98
-
99
-
100
-
101
-
102
-
103
-
104
-
105
-
106
-
107
-
108
-
109
-
110
-
111
-
112
-
113
-
114
-
115
-
116
-
117
-
118
-
119
-
120
-
121
-
122
-
123
-
124
-
125
 |
 |

Table of Contents
determine that we would be able to realize our deferred tax assets in the future in excess of our net recorded amount, an adjustment to the deferred tax asset
would increase our income or reduce our loss and increase stockholders' equity in the quarter when such determination is made.
The change in the valuation allowance of $8.5 million is primarily due to the uncertainties of realizing certain domestic losses, net operating losses
incurred by the Japanese joint venture and certain tax credit carryforwards. The balance in the valuation allowance at the end of fiscal 2005 includes
approximately $8.1 million for stock plan deductions, which will be credited to additional capital and the provision for income taxes if realized.
We currently believe that our fiscal 2006 effective tax rate will be approximately 25 percent, exclusive of the impact of expensing stock options
beginning in the third quarter of fiscal 2006. Our future effective tax rate is based on the projected mix of full-year income in each tax jurisdiction in which
we operate and the related income tax expense in each jurisdiction. The estimated effective income tax rate is also adjusted for taxes related to significant
unusual items. These actual results could vary from those projected.
Fiscal Years Ended January 31, 2004 and 2003
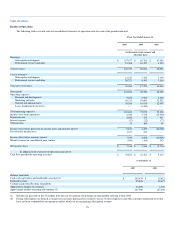
Revenues. Total revenues were $96.0 million for fiscal 2004, compared to $51.0 million during fiscal 2003, an increase of $45.0 million, or 88 percent.
Subscription and support revenues were $85.8 million, or 89 percent of total revenues, for fiscal 2004, compared to $47.7 million, or 93 percent of total
revenues, for fiscal 2003. The increase in subscription and support revenues was due primarily to the increase in the number of paying subscribers to
approximately 127,000 as of January 31, 2004 from approximately 76,000 as of January 31, 2003. Professional services and other revenues were $10.2
million, or 11 percent of total revenues, for fiscal 2004, compared to $3.3 million, or 7 percent of total revenues, for fiscal 2003. The increase in professional
service and other revenues was due primarily to the higher demand for services from an increasing number of paying subscribers and customers.
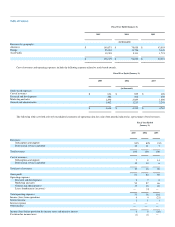
Revenues in Europe and Asia Pacific accounted for $17.1 million, or 18 percent of total revenues, during fiscal 2004, compared to $7.1 million, or 14
percent of total revenues, during fiscal 2003, an increase of $10.0 million, or 141 percent. The increase in revenues outside of the Americas was the result of
our efforts to expand the number of locations around the world where we conduct business and the expansion of our international selling and marketing
activities.
Cost of Revenues. Cost of revenues was $17.3 million, or 18 percent of total revenues, during fiscal 2004, compared to $10.4 million, or 20 percent of
total revenues, during fiscal 2003, an increase of $6.9 million. The increase was primarily due to an increase of $5.4 million in employee-related costs,
substantially all of which was due to the 53 percent increase in the headcount of our professional services organization, and an increase of $700,000 in service
delivery costs. We increased the professional services headcount in order to meet the higher demand for our consulting and training services as our customer
base has expanded.
The increase in our gross profit was the result of our ability to leverage our existing infrastructure to serve new customers and paying subscribers.
Research and Development. Research and development expenses were $7.0 million, or 7 percent of total revenues, during fiscal 2004, compared to $4.6
million, or 9 percent of total revenues, during fiscal 2003, an increase of $2.4 million. The increase was primarily due to an increase of $1.8 million in
employee-related costs. Our research and development headcount increased by 57 percent from fiscal 2003 as we added personnel to upgrade and extend our
service offerings.
Marketing and Sales. Marketing and sales expenses were $54.6 million, or 57 percent of total revenues, during fiscal 2004, compared to $33.5 million,
or 66 percent of total revenues, during fiscal 2003, an increase of $21.1 million. The increase was primarily due to an increase of $18.0 million in employee-
related costs, $1.0 million in increased marketing event costs, $800,000 in payments to partners, and $700,000 in allocated
30