Salesforce.com 2004 Annual Report Download - page 23
Download and view the complete annual report
Please find page 23 of the 2004 Salesforce.com annual report below. You can navigate through the pages in the report by either clicking on the pages listed below, or by using the keyword search tool below to find specific information within the annual report.-
 1
1 -
2
-
3
-
4
-
5
-
6
-
7
-
8
-
9
-
10
-
11
-
12
-
 13
13 -
 14
14 -
 15
15 -
 16
16 -
 17
17 -
 18
18 -
 19
19 -
 20
20 -
 21
21 -
 22
22 -
 23
23 -
 24
24 -
 25
25 -
 26
26 -
 27
27 -
 28
28 -
 29
29 -
 30
30 -
 31
31 -
 32
32 -
 33
33 -
34
-
35
-
36
-
37
-
38
-
39
-
40
-
41
-
42
-
43
-
44
-
45
-
46
-
47
-
48
-
49
-
50
-
51
-
52
-
53
-
54
-
55
-
56
-
57
-
58
-
59
-
60
-
61
-
62
-
63
-
64
-
65
-
66
-
67
-
68
-
69
-
70
-
71
-
72
-
73
-
74
-
75
-
76
-
77
-
78
-
79
-
80
-
81
-
82
-
83
-
84
-
85
-
86
-
87
-
88
-
89
-
90
-
91
-
92
-
93
-
94
-
95
-
96
-
97
-
98
-
99
-
100
-
101
-
102
-
103
-
104
-
105
-
106
-
107
-
108
-
109
-
110
-
111
-
112
-
113
-
114
-
115
-
116
-
117
-
118
-
119
-
120
-
121
-
122
-
123
-
124
-
125
 |
 |
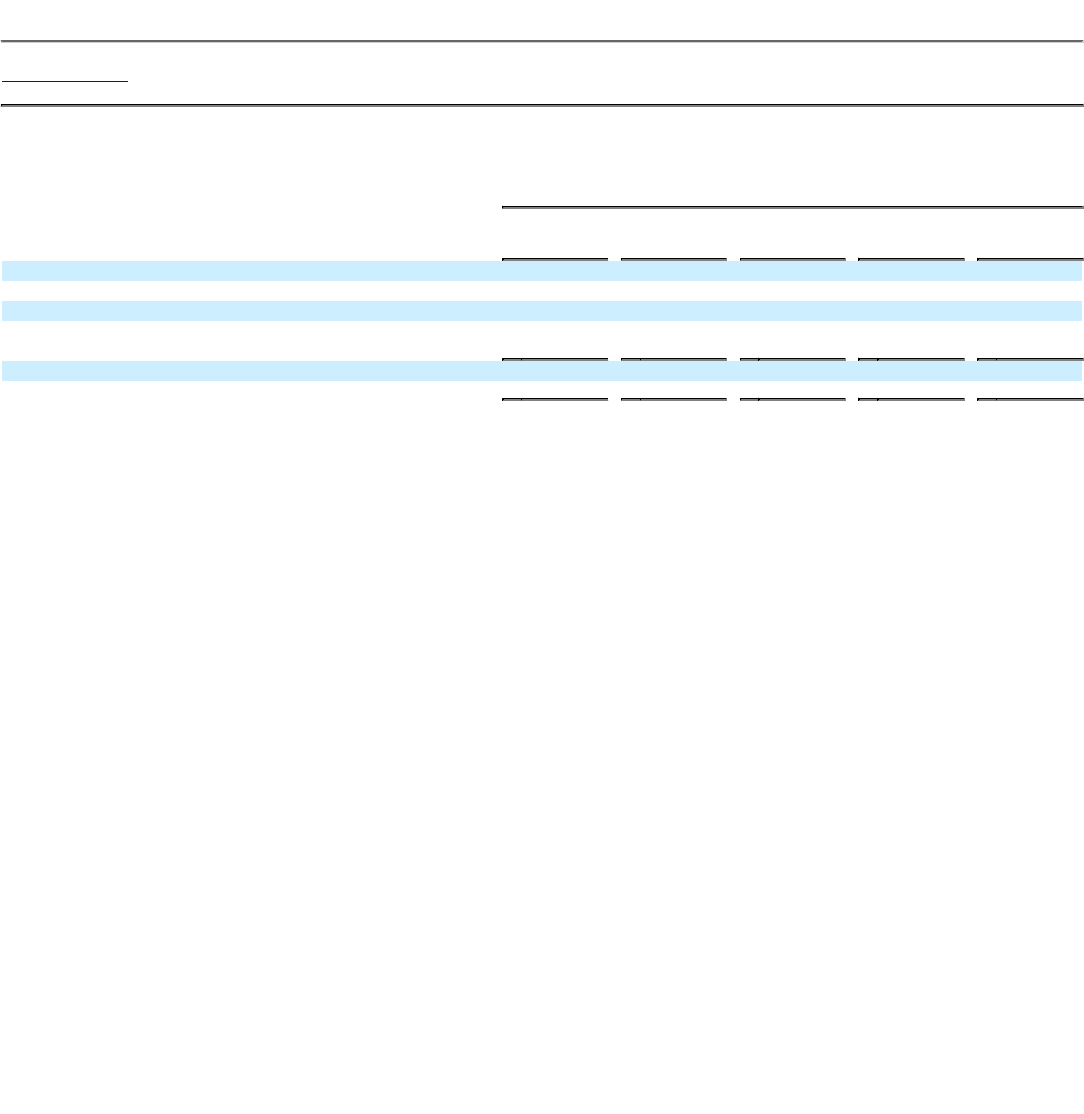
Table of Contents
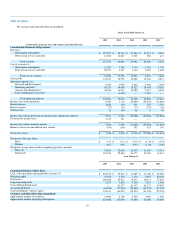
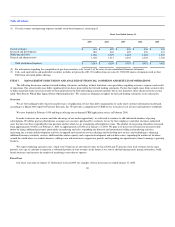
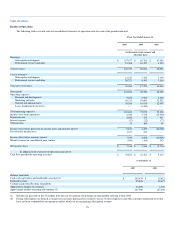
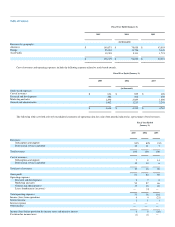
(1) Cost of revenues and operating expenses include stock-based expenses, consisting of:
Fiscal Year Ended January 31,
2005
2004
2003
2002
2001
Cost of revenues $ 634 $ 655 $ 428 $ 369 $ 345
Research and development 282 462 402 436 431
Marketing and sales 1,296 2,029 1,696 1,422 1,350
General and administrative 1,402 1,213 2,241 2,224 1,326
Total stock-based expenses $ 3,614 $ 4,359 $ 4,767 $ 4,451 $ 3,452
(2) For information regarding the computation of per share amounts, refer to note 1 of the notes to our consolidated financial statements.
(3) Cash, cash equivalents and marketable securities includes net proceeds of $113.8 million from our sale of 11,500,000 shares of common stock in June
2004 from our initial public offering.
ITEM 7. MANAGEMENT'S DISCUSSION AND ANALYSIS OF FINANCIAL CONDITION AND RESULTS OF OPERATIONS
The following discussion contains forward-looking statements, including, without limitation, our expectations regarding revenues, expenses and results
of operations. Our actual results may differ significantly from those projected in the forward-looking statements. Factors that might cause future actual results
to differ materially from our recent results or those projected in the forward-looking statements include, but are not limited to, those discussed in the section
titled "Risk Factors Which May Impact Future Operating Results." We assume no obligation to update the forward-looking statements or our risk factors.
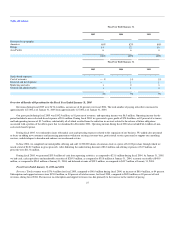
Overview
We are the leading provider, based on market share, of application services that allow organizations to easily share customer information on demand,
according to a March 2004 report by Forrester Research, Inc. We provide a comprehensive CRM service to businesses of all sizes and industries worldwide.
We were founded in February 1999 and began offering our on-demand CRM application service in February 2000.
In order to increase our revenues and take advantage of our market opportunity, we will need to continue to add substantial numbers of paying
subscriptions. We define paying subscriptions as unique user accounts, purchased by customers for use by their employees and other customer-authorized
users that have not been suspended for non-payment and for which we are recognizing subscription revenue. The number of our paying subscribers increased
from approximately 30,000 as of February 1, 2001 to approximately 227,000 as of January 31, 2005. We plan to re-invest our revenues for the foreseeable
future by hiring additional personnel, particularly in marketing and sales; expanding our domestic and international selling and marketing activities;
increasing our research and development activities to upgrade and extend our service offerings and to develop new services and technologies; obtaining
additional business continuity services, additional data center capacity and a separate development and test data center; expanding the number of locations
around the world where we conduct business; adding to our infrastructure to support our growth; and expanding our operational systems to manage a growing
business.
We expect marketing and sales costs, which were 55 percent of our total revenues for fiscal 2005 and 57 percent of our total revenues for the same
period a year ago, to continue to represent a substantial portion of total revenues in the future as we seek to add and manage more paying subscribers, build
brand awareness and increase the number of marketing events that we sponsor.
Fiscal Year
Our fiscal year ends on January 31. References to fiscal 2005, for example, refer to the fiscal year ended January 31, 2005.
20