Salesforce.com 2004 Annual Report Download - page 54
Download and view the complete annual report
Please find page 54 of the 2004 Salesforce.com annual report below. You can navigate through the pages in the report by either clicking on the pages listed below, or by using the keyword search tool below to find specific information within the annual report.-
 1
1 -
2
-
3
-
4
-
5
-
6
-
7
-
8
-
9
-
10
-
11
-
12
-
13
-
14
-
15
-
16
-
17
-
18
-
19
-
20
-
21
-
22
-
23
-
24
-
25
-
26
-
27
-
28
-
29
-
30
-
31
-
32
-
33
-
34
-
35
-
36
-
37
-
38
-
39
-
40
-
41
-
42
-
43
-
 44
44 -
 45
45 -
 46
46 -
 47
47 -
 48
48 -
 49
49 -
 50
50 -
 51
51 -
 52
52 -
 53
53 -
 54
54 -
 55
55 -
 56
56 -
 57
57 -
 58
58 -
 59
59 -
 60
60 -
 61
61 -
 62
62 -
 63
63 -
 64
64 -
65
-
66
-
67
-
68
-
69
-
70
-
71
-
72
-
73
-
74
-
75
-
76
-
77
-
78
-
79
-
80
-
81
-
82
-
83
-
84
-
85
-
86
-
87
-
88
-
89
-
90
-
91
-
92
-
93
-
94
-
95
-
96
-
97
-
98
-
99
-
100
-
101
-
102
-
103
-
104
-
105
-
106
-
107
-
108
-
109
-
110
-
111
-
112
-
113
-
114
-
115
-
116
-
117
-
118
-
119
-
120
-
121
-
122
-
123
-
124
-
125
 |
 |
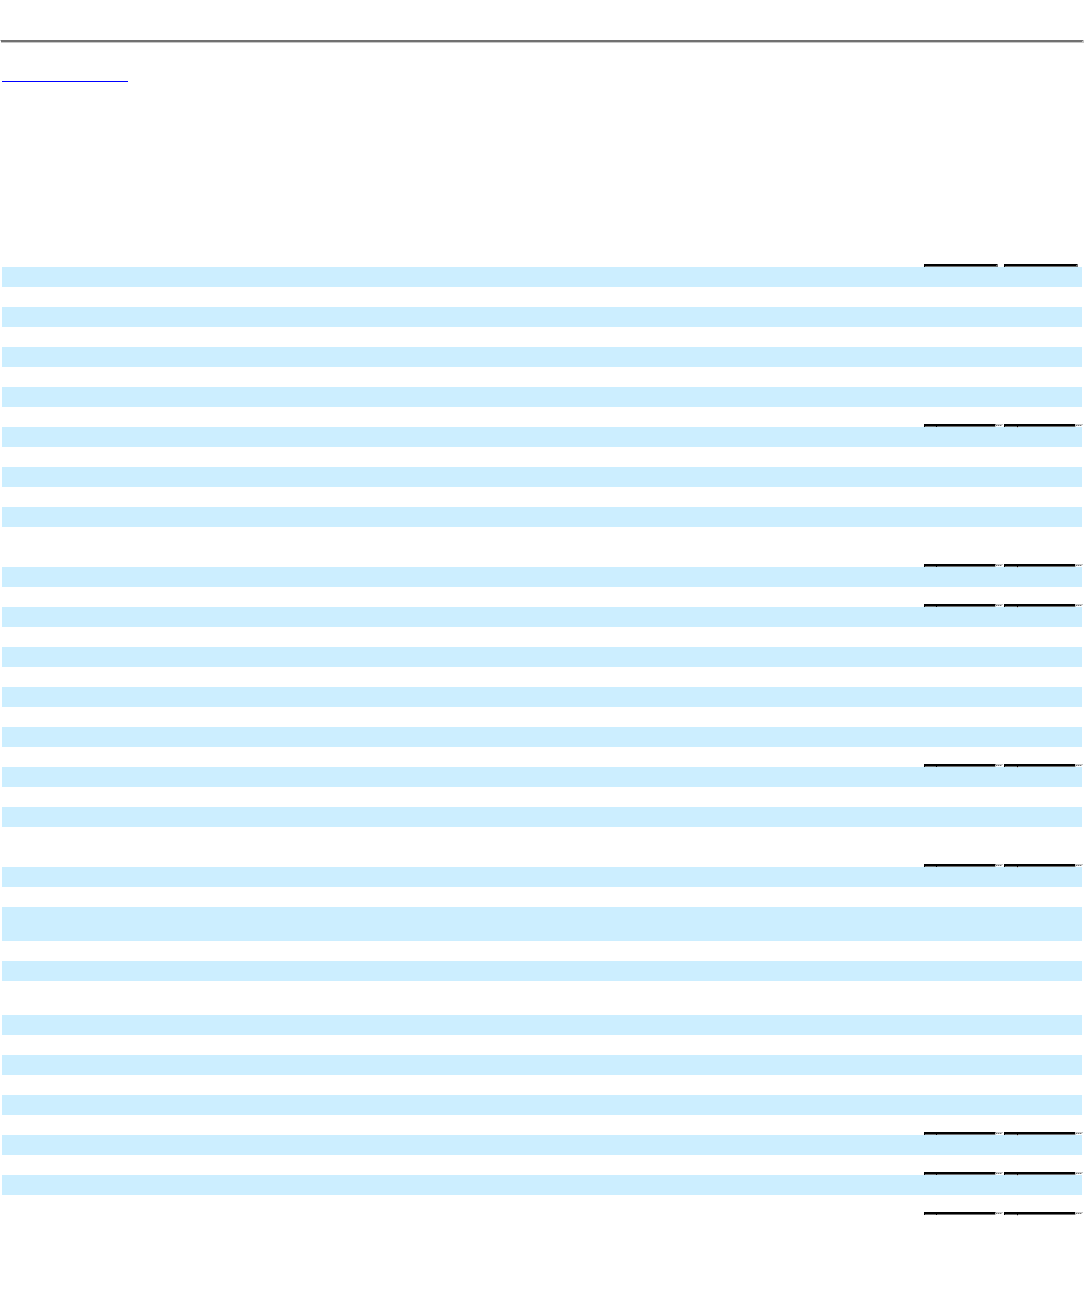
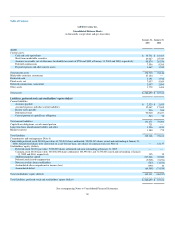
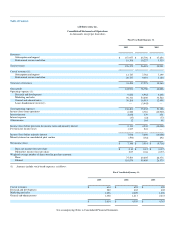
Table of Contents
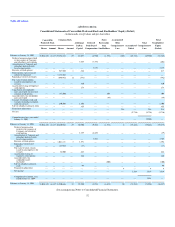
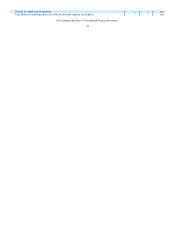
salesforce.com, inc.
Consolidated Balance Sheets
(in thousands, except share and per share data)
January 31,
2005
January 31,
2004
Assets
Current assets:
Cash and cash equivalents $ 35,731 $ 10,463
Short-term marketable securities 83,087 25,349
Accounts receivable, net of allowance for doubtful accounts of $750 and $349 at January 31, 2005 and 2004, respectively 48,874 26,536
Deferred commissions 7,556 8,266
Prepaid expenses and other current assets 3,467 3,532
Total current assets 178,715 74,146
Marketable securities, noncurrent 87,120 —
Restricted cash 3,191 3,912
Fixed assets, net 7,637 5,069
Deferred commissions, noncurrent 2,057 2,890
Other assets 1,779 1,494
Total assets $ 280,499 $ 87,511
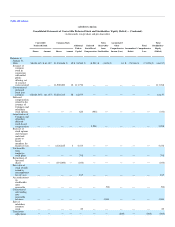
Liabilities, preferred stock and stockholders' equity (deficit)
Current liabilities:
Accounts payable $ 2,525 $ 2,035
Accrued expenses and other current liabilities 32,467 17,682
Income taxes payable 216 534
Deferred revenue 95,900 49,677
Current portion of capital lease obligation 563 78
Total current liabilities 131,671 70,006
Capital lease obligations, net of current portion 721 —
Long-term lease abandonment liability and other 1,596 1,830
Minority interest 1,380 775
Total liabilities 135,368 72,611
Commitments and contingencies (Note 8)
Convertible preferred stock, $0.001 par value; 63,738,843 shares authorized, 58,024,345 shares issued and outstanding at January 31,
2004. All preferred shares were converted, on a one-for-one basis, into shares of common stock (see Note 4) — 61,137
Stockholders' equity (deficit):
Preferred stock, $0.001 par value; 5,000,000 shares authorized and none outstanding at January 31, 2005 — —
Common stock, $0.001 par value; 400,000,000 shares authorized, 104,990,816 and 31,530,626 issued and outstanding at January
31, 2005 and 2004, respectively 105 32
Additional paid-in capital 217,248 35,580
Deferred stock-based compensation (5,908) (8,251)
Notes receivables from stockholders (727) (1,674)
Accumulated other comprehensive income (loss) (999) 10
Accumulated deficit (64,588) (71,934)
Total stockholders' equity (deficit) 145,131 (46,237)
Total liabilities, preferred stock and stockholders' equity (deficit) $ 280,499 $ 87,511
See accompanying Notes to Consolidated Financial Statements.
50