HSBC 2012 Annual Report Download - page 71
Download and view the complete annual report
Please find page 71 of the 2012 HSBC annual report below. You can navigate through the pages in the report by either clicking on the pages listed below, or by using the keyword search tool below to find specific information within the annual report.-
 1
1 -
2
-
3
-
4
-
5
-
6
-
7
-
8
-
9
-
10
-
11
-
12
-
13
-
14
-
15
-
16
-
17
-
18
-
19
-
20
-
21
-
22
-
23
-
24
-
25
-
26
-
27
-
28
-
29
-
30
-
31
-
32
-
33
-
34
-
35
-
36
-
37
-
38
-
39
-
40
-
41
-
42
-
43
-
44
-
45
-
46
-
47
-
48
-
49
-
50
-
51
-
52
-
53
-
54
-
55
-
56
-
57
-
58
-
59
-
60
-
 61
61 -
 62
62 -
 63
63 -
 64
64 -
 65
65 -
 66
66 -
 67
67 -
 68
68 -
 69
69 -
 70
70 -
 71
71 -
 72
72 -
 73
73 -
 74
74 -
 75
75 -
 76
76 -
 77
77 -
 78
78 -
 79
79 -
 80
80 -
 81
81 -
82
-
83
-
84
-
85
-
86
-
87
-
88
-
89
-
90
-
91
-
92
-
93
-
94
-
95
-
96
-
97
-
98
-
99
-
100
-
101
-
102
-
103
-
104
-
105
-
106
-
107
-
108
-
109
-
110
-
111
-
112
-
113
-
114
-
115
-
116
-
117
-
118
-
119
-
120
-
121
-
122
-
123
-
124
-
125
-
126
-
127
-
128
-
129
-
130
-
131
-
132
-
133
-
134
-
135
-
136
-
137
-
138
-
139
-
140
-
141
-
142
-
143
-
144
-
145
-
146
-
147
-
148
-
149
-
150
-
151
-
152
-
153
-
154
-
155
-
156
-
157
-
158
-
159
-
160
-
161
-
162
-
163
-
164
-
165
-
166
-
167
-
168
-
169
-
170
-
171
-
172
-
173
-
174
-
175
-
176
-
177
-
178
-
179
-
180
-
181
-
182
-
183
-
184
-
185
-
186
-
187
-
188
-
189
-
190
-
191
-
192
-
193
-
194
-
195
-
196
-
197
-
198
-
199
-
200
-
201
-
202
-
203
-
204
-
205
-
206
-
207
-
208
-
209
-
210
-
211
-
212
-
213
-
214
-
215
-
216
-
217
-
218
-
219
-
220
-
221
-
222
-
223
-
224
-
225
-
226
-
227
-
228
-
229
-
230
-
231
-
232
-
233
-
234
-
235
-
236
-
237
-
238
-
239
-
240
-
241
-
242
-
243
-
244
-
245
-
246
-
247
-
248
-
249
-
250
-
251
-
252
-
253
-
254
-
255
-
256
-
257
-
258
-
259
-
260
-
261
-
262
-
263
-
264
-
265
-
266
-
267
-
268
-
269
-
270
-
271
-
272
-
273
-
274
-
275
-
276
-
277
-
278
-
279
-
280
-
281
-
282
-
283
-
284
-
285
-
286
-
287
-
288
-
289
-
290
-
291
-
292
-
293
-
294
-
295
-
296
-
297
-
298
-
299
-
300
-
301
-
302
-
303
-
304
-
305
-
306
-
307
-
308
-
309
-
310
-
311
-
312
-
313
-
314
-
315
-
316
-
317
-
318
-
319
-
320
-
321
-
322
-
323
-
324
-
325
-
326
-
327
-
328
-
329
-
330
-
331
-
332
-
333
-
334
-
335
-
336
-
337
-
338
-
339
-
340
-
341
-
342
-
343
-
344
-
345
-
346
-
347
-
348
-
349
-
350
-
351
-
352
-
353
-
354
-
355
-
356
-
357
-
358
-
359
-
360
-
361
-
362
-
363
-
364
-
365
-
366
-
367
-
368
-
369
-
370
-
371
-
372
-
373
-
374
-
375
-
376
-
377
-
378
-
379
-
380
-
381
-
382
-
383
-
384
-
385
-
386
-
387
-
388
-
389
-
390
-
391
-
392
-
393
-
394
-
395
-
396
-
397
-
398
-
399
-
400
-
401
-
402
-
403
-
404
-
405
-
406
-
407
-
408
-
409
-
410
-
411
-
412
-
413
-
414
-
415
-
416
-
417
-
418
-
419
-
420
-
421
-
422
-
423
-
424
-
425
-
426
-
427
-
428
-
429
-
430
-
431
-
432
-
433
-
434
-
435
-
436
-
437
-
438
-
439
-
440
-
441
-
442
-
443
-
444
-
445
-
446
-
447
-
448
-
449
-
450
-
451
-
452
-
453
-
454
-
455
-
456
-
457
-
458
-
459
-
460
-
461
-
462
-
463
-
464
-
465
-
466
-
467
-
468
-
469
-
470
-
471
-
472
-
473
-
474
-
475
-
476
-
477
-
478
-
479
-
480
-
481
-
482
-
483
-
484
-
485
-
486
-
487
-
488
-
489
-
490
-
491
-
492
-
493
-
494
-
495
-
496
-
497
-
498
-
499
-
500
-
501
-
502
-
503
-
504
-
505
-
506
-
507
-
508
-
509
-
510
-
511
-
512
-
513
-
514
-
515
-
516
-
517
-
518
-
519
-
520
-
521
-
522
-
523
-
524
-
525
-
526
-
527
-
528
-
529
-
530
-
531
-
532
-
533
-
534
-
535
-
536
-
537
-
538
-
539
-
540
-
541
-
542
-
543
-
544
-
545
-
546
 |
 |

69
Overview Operating & Financial Review Corporate Governance Financial Statements Shareholder Information
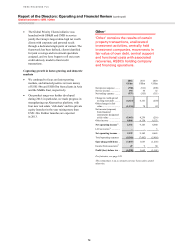
Global Banking and on the legacy credit loans
and receivables portfolio.
• Operating expenses increased by US$393m to
US$9.9bn, predominantly due to a customer
redress provision of US$330m relating to
interest rate protection products in the UK (see
page 32). Performance costs rose, albeit at a
lower rate of growth than net operating income,
which resulted in a lower total compensation
ratio than in 2011. 2011 also included a credit
of US$108m (US$111m as reported) relating to
defined benefit pension obligations in the UK,
which did not recur.
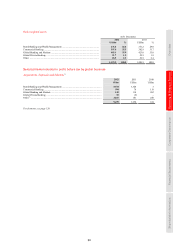
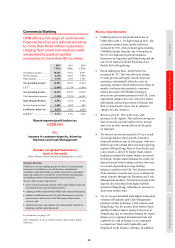
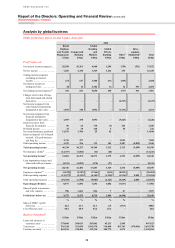
Management view of total operating income
2012
US$m
2011
US$m
2010
US$m
Global Markets79 ........ 8,733 8,098 9,173
Credit ..................... 779 335 1,649
Rates ...................... 1,771 1,341 2,052
Foreign Exchange .. 3,215 3,272 2,752
Equities .................. 679 961 755
Securities Services . 1,663 1,673 1,511
Asset and Structured
Finance ................ 626
516 454
Global Banking .......... 5,568 5,401 4,621
Financing and Equity
Capital Markets .. 3,071
3,233 2,852
Payments and Cash
Management80 ..... 1,744
1,534 1,133
Other transaction
services81 ............. 753
634 636
Balance Sheet
Management82 ........ 3,738 3,488 4,102
Principal Investments 125 209 319
Debit valuation
adjustment .............. 518 – –
Other83 ........................ (409) (139) 697
Total operating
income...................... 18,273 17,057 18,912
Balance Sheet Management revenues included a notional tax
credit on income earned from tax-exempt investments of
US$116m in 2012 (2011: US$85m; 2010: US$50m), which is
offset above within ‘Other.’
For footnotes, see page 120.
• Included in the table above are the following
amounts in relation to the change in credit
valuation adjustment estimation methodology:
2012
US$m
Credit .................................................................... (52)
Rates ..................................................................... (837)
Foreign Exchange ................................................. (7)
Equities ................................................................. (7)
Total ...................................................................... (903)
• Global Markets delivered a strong performance
in an uncertain financial and economic
environment, in part due to a US$444m increase
in Rates revenues. This was despite significant
adverse fair value movements from own credit
spreads on structured liabilities as spreads
tightened, compared with favourable
movements reported in 2011, together with a
credit valuation adjustment of US$837m in
2012. Revenues in Credit increased by
US$453m due to strong trading income, mainly
in Europe, as spreads tightened on corporate
debt securities. Additionally, we achieved
record reported revenues from primary market
issuance, mainly within Credit, with revenues
in Europe, Hong Kong and North America
increasing as we enhanced regional coverage
and actively captured growth in client demand
for debt capital financing.
• Foreign Exchange income was broadly in line
with 2011, as higher revenues from enhanced
collaboration between GB&M and CMB, and
increased volumes from the improvement in our
electronic pricing and distribution capabilities,
offset the effect of less volatile markets in 2012.
Notwithstanding the capture of higher market
share within a number of our target emerging
markets, Equities revenues decreased by 27%,
driven by lower client activity as market
volumes declined against the backdrop of
economic and fiscal uncertainty in Europe and
North America. This was coupled with adverse
fair value movements on structured liabilities
compared with favourable movements in 2011.
• In Global Banking, Financing and Equity
Capital Markets revenues were broadly
unchanged compared with 2011 as lower
advisory and underwriting fees, mainly in
Europe, reflecting the challenging market
environment, were partly offset by higher
Project and Export Finance revenues, as deal
volumes increased, and as we captured a higher
market share of public and private sector
investment in infrastructure development in
emerging markets. Payments and Cash
Management revenues increased by 15% due to
higher average liability balances and an increase
in transaction volumes. We increased our focus
on cross-selling Payments and Cash
Management products to selected international
customers and saw a rise in new mandates.
• In ‘Other transaction services’, revenues
increased by 24% as the Global Trade and
Receivables Finance business benefited from
enhanced collaboration between Global Banking