HSBC 2012 Annual Report Download - page 35
Download and view the complete annual report
Please find page 35 of the 2012 HSBC annual report below. You can navigate through the pages in the report by either clicking on the pages listed below, or by using the keyword search tool below to find specific information within the annual report.-
 1
1 -
2
-
3
-
4
-
5
-
6
-
7
-
8
-
9
-
10
-
11
-
12
-
13
-
14
-
15
-
16
-
17
-
18
-
19
-
20
-
21
-
22
-
23
-
24
-
 25
25 -
 26
26 -
 27
27 -
 28
28 -
 29
29 -
 30
30 -
 31
31 -
 32
32 -
 33
33 -
 34
34 -
 35
35 -
 36
36 -
 37
37 -
 38
38 -
 39
39 -
 40
40 -
 41
41 -
 42
42 -
 43
43 -
 44
44 -
 45
45 -
46
-
47
-
48
-
49
-
50
-
51
-
52
-
53
-
54
-
55
-
56
-
57
-
58
-
59
-
60
-
61
-
62
-
63
-
64
-
65
-
66
-
67
-
68
-
69
-
70
-
71
-
72
-
73
-
74
-
75
-
76
-
77
-
78
-
79
-
80
-
81
-
82
-
83
-
84
-
85
-
86
-
87
-
88
-
89
-
90
-
91
-
92
-
93
-
94
-
95
-
96
-
97
-
98
-
99
-
100
-
101
-
102
-
103
-
104
-
105
-
106
-
107
-
108
-
109
-
110
-
111
-
112
-
113
-
114
-
115
-
116
-
117
-
118
-
119
-
120
-
121
-
122
-
123
-
124
-
125
-
126
-
127
-
128
-
129
-
130
-
131
-
132
-
133
-
134
-
135
-
136
-
137
-
138
-
139
-
140
-
141
-
142
-
143
-
144
-
145
-
146
-
147
-
148
-
149
-
150
-
151
-
152
-
153
-
154
-
155
-
156
-
157
-
158
-
159
-
160
-
161
-
162
-
163
-
164
-
165
-
166
-
167
-
168
-
169
-
170
-
171
-
172
-
173
-
174
-
175
-
176
-
177
-
178
-
179
-
180
-
181
-
182
-
183
-
184
-
185
-
186
-
187
-
188
-
189
-
190
-
191
-
192
-
193
-
194
-
195
-
196
-
197
-
198
-
199
-
200
-
201
-
202
-
203
-
204
-
205
-
206
-
207
-
208
-
209
-
210
-
211
-
212
-
213
-
214
-
215
-
216
-
217
-
218
-
219
-
220
-
221
-
222
-
223
-
224
-
225
-
226
-
227
-
228
-
229
-
230
-
231
-
232
-
233
-
234
-
235
-
236
-
237
-
238
-
239
-
240
-
241
-
242
-
243
-
244
-
245
-
246
-
247
-
248
-
249
-
250
-
251
-
252
-
253
-
254
-
255
-
256
-
257
-
258
-
259
-
260
-
261
-
262
-
263
-
264
-
265
-
266
-
267
-
268
-
269
-
270
-
271
-
272
-
273
-
274
-
275
-
276
-
277
-
278
-
279
-
280
-
281
-
282
-
283
-
284
-
285
-
286
-
287
-
288
-
289
-
290
-
291
-
292
-
293
-
294
-
295
-
296
-
297
-
298
-
299
-
300
-
301
-
302
-
303
-
304
-
305
-
306
-
307
-
308
-
309
-
310
-
311
-
312
-
313
-
314
-
315
-
316
-
317
-
318
-
319
-
320
-
321
-
322
-
323
-
324
-
325
-
326
-
327
-
328
-
329
-
330
-
331
-
332
-
333
-
334
-
335
-
336
-
337
-
338
-
339
-
340
-
341
-
342
-
343
-
344
-
345
-
346
-
347
-
348
-
349
-
350
-
351
-
352
-
353
-
354
-
355
-
356
-
357
-
358
-
359
-
360
-
361
-
362
-
363
-
364
-
365
-
366
-
367
-
368
-
369
-
370
-
371
-
372
-
373
-
374
-
375
-
376
-
377
-
378
-
379
-
380
-
381
-
382
-
383
-
384
-
385
-
386
-
387
-
388
-
389
-
390
-
391
-
392
-
393
-
394
-
395
-
396
-
397
-
398
-
399
-
400
-
401
-
402
-
403
-
404
-
405
-
406
-
407
-
408
-
409
-
410
-
411
-
412
-
413
-
414
-
415
-
416
-
417
-
418
-
419
-
420
-
421
-
422
-
423
-
424
-
425
-
426
-
427
-
428
-
429
-
430
-
431
-
432
-
433
-
434
-
435
-
436
-
437
-
438
-
439
-
440
-
441
-
442
-
443
-
444
-
445
-
446
-
447
-
448
-
449
-
450
-
451
-
452
-
453
-
454
-
455
-
456
-
457
-
458
-
459
-
460
-
461
-
462
-
463
-
464
-
465
-
466
-
467
-
468
-
469
-
470
-
471
-
472
-
473
-
474
-
475
-
476
-
477
-
478
-
479
-
480
-
481
-
482
-
483
-
484
-
485
-
486
-
487
-
488
-
489
-
490
-
491
-
492
-
493
-
494
-
495
-
496
-
497
-
498
-
499
-
500
-
501
-
502
-
503
-
504
-
505
-
506
-
507
-
508
-
509
-
510
-
511
-
512
-
513
-
514
-
515
-
516
-
517
-
518
-
519
-
520
-
521
-
522
-
523
-
524
-
525
-
526
-
527
-
528
-
529
-
530
-
531
-
532
-
533
-
534
-
535
-
536
-
537
-
538
-
539
-
540
-
541
-
542
-
543
-
544
-
545
-
546
 |
 |

33
Overview Operating & Financial Review Corporate Governance Financial Statements Shareholder Information
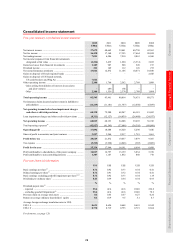
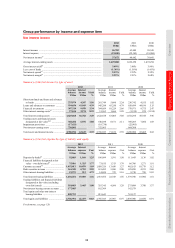
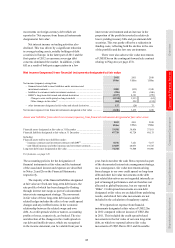
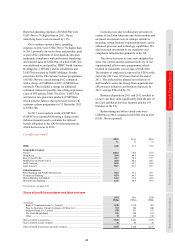
Group performance by income and expense item
Net interest income
2012 2011 2010
US$m US$m US$m
Interest income ........................................................................................................... 56,702 63,005 58,345
Interest expense .......................................................................................................... (19,030) (22,343) (18,904)
Net interest income39 .................................................................................................. 37,672 40,662 39,441
Average interest-earning assets .................................................................................. 1,625,068 1,622,658 1,472,294
Gross interest yield40 ................................................................................................... 3.49% 3.88% 3.96%
Less: cost of funds ...................................................................................................... (1.36%) (1.56%) (1.41%)
Net interest spread41 .................................................................................................... 2.13% 2.32% 2.55%
Net interest margin42 ................................................................................................... 2.32% 2.51% 2.68%
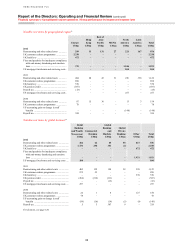
Summary of interest income by type of asset
2012 2011 2010
Average
balance
Interest
income Yield
Average
balance
Interest
income Yield
Average
balance
Interest
income Yield
US$m US$m % US$m US$m % US$m US$m %
Short-term funds and loans and advances
to banks ................................................... 275,979 4,307 1.56 261,749 5,860 2.24
236,742 4,555 1.92
Loans and advances to customers .............. 934,656 41,043 4.39 945,288 45,250 4.79 858,499 44,186 5.15
Financial investments ................................. 387,329 9,078 2.34 384,059 10,229 2.66 378,971 9,375 2.47
Other interest-earning assets43 .................... 27,104 2,274 8.39 31,562 1,666 5.28 (1,918) 229 (11.94)
Total interest-earning assets ....................... 1,625,068 56,702 3.49 1,622,658 63,005 3.88 1,472,294 58,345 3.96
Trading assets and financial assets
designated at fair value44,45 ..................... 368,406 6,931 1.88 410,038 8,671 2.11
385,203 7,060 1.83
Impairment provisions ................................ (17,421) (18,738) (22,905)
Non-interest-earning assets ........................ 730,901 752,965 664,308
Total assets and interest income ................. 2,706,954 63,633 2.35 2,766,923 71,676 2.59 2,498,900 65,405 2.62
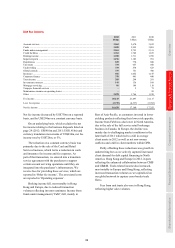
Summary of interest expense by type of liability and equity
2012 2011 2010
Average
balance
Interest
expense Cost
Average
balance
Interest
expense Cost
Average
balance
Interest
expense Cost
US$m US$m % US$m US$m % US$m US$m %
Deposits by banks46 .................................... 92,803 1,160 1.25 106,099 1,591 1.50 111,443 1,136 1.02
Financial liabilities designated at fair
value – own debt issued47 ....................... 75,016 1,325 1.77 73,635 1,313 1.78
66,706 1,271 1.91
Customer accounts48 ................................... 1,052,812 10,878 1.03 1,058,326 13,456 1.27 962,613 10,778 1.12
Debt securities in issue ............................... 161,348 4,755 2.95 181,482 5,260 2.90 189,898 4,931 2.60
Other interest-bearing liabilities ................. 19,275 912 4.73 14,024 723 5.16 8,730 788 9.03
Total interest-bearing liabilities .................. 1,401,254 19,030 1.36 1,433,566 22,343 1.56 1,339,390 18,904 1.41
Trading liabilities and financial liabilities
designated at fair value (excluding
own debt issued) ..................................... 318,883 3,445 1.08 355,345 4,564 1.28
275,804 3,780 1.37
Non-interest bearing current accounts ........ 177,085 162,369 142,579
Total equity and other non-interest
bearing liabilities .................................... 809,732 815,643 741,127
Total equity and liabilities .......................... 2,706,954 22,475 0.83 2,766,923 26,907 0.97 2,498,900 22,684 0.91
For footnotes, see page 120.