HSBC 2012 Annual Report Download - page 109
Download and view the complete annual report
Please find page 109 of the 2012 HSBC annual report below. You can navigate through the pages in the report by either clicking on the pages listed below, or by using the keyword search tool below to find specific information within the annual report.-
 1
1 -
 2
2 -
 3
3 -
 4
4 -
 5
5 -
 6
6 -
 7
7 -
 8
8 -
 9
9 -
 10
10 -
 11
11 -
 12
12 -
 13
13 -
 14
14 -
 15
15 -
 16
16 -
 17
17 -
 18
18 -
 19
19 -
 20
20 -
 21
21 -
 22
22 -
 23
23 -
 24
24 -
 25
25 -
 26
26 -
 27
27 -
 28
28 -
 29
29 -
 30
30 -
 31
31 -
 32
32 -
 33
33 -
 34
34 -
 35
35 -
 36
36 -
 37
37 -
 38
38 -
 39
39 -
 40
40 -
 41
41 -
 42
42 -
 43
43 -
 44
44 -
 45
45 -
 46
46 -
 47
47 -
 48
48 -
 49
49 -
 50
50 -
 51
51 -
 52
52 -
 53
53 -
 54
54 -
 55
55 -
 56
56 -
 57
57 -
 58
58 -
 59
59 -
 60
60 -
 61
61 -
 62
62 -
 63
63 -
 64
64 -
 65
65 -
 66
66 -
 67
67 -
 68
68 -
 69
69 -
 70
70 -
 71
71 -
 72
72 -
 73
73 -
 74
74 -
 75
75 -
 76
76 -
 77
77 -
 78
78 -
 79
79 -
 80
80 -
 81
81 -
 82
82 -
 83
83 -
 84
84 -
 85
85 -
 86
86 -
 87
87 -
 88
88 -
 89
89 -
 90
90 -
 91
91 -
 92
92 -
 93
93 -
 94
94 -
 95
95 -
 96
96 -
 97
97 -
 98
98 -
 99
99 -
 100
100 -
 101
101 -
 102
102 -
 103
103 -
 104
104 -
 105
105 -
 106
106 -
 107
107 -
 108
108 -
 109
109 -
 110
110 -
 111
111 -
 112
112 -
 113
113 -
 114
114 -
 115
115 -
 116
116 -
 117
117 -
 118
118 -
 119
119 -
 120
120 -
 121
121 -
 122
122 -
 123
123 -
 124
124 -
 125
125 -
 126
126 -
 127
127 -
 128
128 -
 129
129 -
 130
130 -
 131
131 -
 132
132 -
 133
133 -
 134
134 -
 135
135 -
 136
136 -
 137
137 -
 138
138 -
 139
139 -
 140
140 -
 141
141 -
 142
142 -
 143
143 -
 144
144 -
 145
145 -
 146
146 -
 147
147 -
 148
148 -
 149
149 -
 150
150 -
 151
151 -
 152
152 -
 153
153 -
 154
154 -
 155
155 -
 156
156 -
 157
157 -
 158
158 -
 159
159 -
 160
160 -
 161
161 -
 162
162 -
 163
163 -
 164
164 -
 165
165 -
 166
166 -
 167
167 -
 168
168 -
 169
169 -
 170
170 -
 171
171 -
 172
172 -
 173
173 -
 174
174 -
 175
175 -
 176
176 -
 177
177 -
 178
178 -
 179
179 -
 180
180 -
 181
181 -
 182
182 -
 183
183 -
 184
184 -
 185
185 -
 186
186 -
 187
187 -
 188
188 -
 189
189 -
 190
190 -
 191
191 -
 192
192 -
 193
193 -
 194
194 -
 195
195 -
 196
196 -
 197
197 -
 198
198 -
 199
199 -
 200
200 -
 201
201 -
 202
202 -
 203
203 -
 204
204 -
 205
205 -
 206
206 -
 207
207 -
 208
208 -
 209
209 -
 210
210 -
 211
211 -
 212
212 -
 213
213 -
 214
214 -
 215
215 -
 216
216 -
 217
217 -
 218
218 -
 219
219 -
 220
220 -
 221
221 -
 222
222 -
 223
223 -
 224
224 -
 225
225 -
 226
226 -
 227
227 -
 228
228 -
 229
229 -
 230
230 -
 231
231 -
 232
232 -
 233
233 -
 234
234 -
 235
235 -
 236
236 -
 237
237 -
 238
238 -
 239
239 -
 240
240 -
 241
241 -
 242
242 -
 243
243 -
 244
244 -
 245
245 -
 246
246 -
 247
247 -
 248
248 -
 249
249 -
 250
250 -
 251
251 -
 252
252 -
 253
253 -
 254
254 -
 255
255 -
 256
256 -
 257
257 -
 258
258 -
 259
259 -
 260
260 -
 261
261 -
 262
262 -
 263
263 -
 264
264 -
 265
265 -
 266
266 -
 267
267 -
 268
268 -
 269
269 -
 270
270 -
 271
271 -
 272
272 -
 273
273 -
 274
274 -
 275
275 -
 276
276 -
 277
277 -
 278
278 -
 279
279 -
 280
280 -
 281
281 -
 282
282 -
 283
283 -
 284
284 -
 285
285 -
 286
286 -
 287
287 -
 288
288 -
 289
289 -
 290
290 -
 291
291 -
 292
292 -
 293
293 -
 294
294 -
 295
295 -
 296
296 -
 297
297 -
 298
298 -
 299
299 -
 300
300 -
 301
301 -
 302
302 -
 303
303 -
 304
304 -
 305
305 -
 306
306 -
 307
307 -
 308
308 -
 309
309 -
 310
310 -
 311
311 -
 312
312 -
 313
313 -
 314
314 -
 315
315 -
 316
316 -
 317
317 -
 318
318 -
 319
319 -
 320
320 -
 321
321 -
 322
322 -
 323
323 -
 324
324 -
 325
325 -
 326
326 -
 327
327 -
 328
328 -
 329
329 -
 330
330 -
 331
331 -
 332
332 -
 333
333 -
 334
334 -
 335
335 -
 336
336 -
 337
337 -
 338
338 -
 339
339 -
 340
340 -
 341
341 -
 342
342 -
 343
343 -
 344
344 -
 345
345 -
 346
346 -
 347
347 -
 348
348 -
 349
349 -
 350
350 -
 351
351 -
 352
352 -
 353
353 -
 354
354 -
 355
355 -
 356
356 -
 357
357 -
 358
358 -
 359
359 -
 360
360 -
 361
361 -
 362
362 -
 363
363 -
 364
364 -
 365
365 -
 366
366 -
 367
367 -
 368
368 -
 369
369 -
 370
370 -
 371
371 -
 372
372 -
 373
373 -
 374
374 -
 375
375 -
 376
376 -
 377
377 -
 378
378 -
 379
379 -
 380
380 -
 381
381 -
 382
382 -
 383
383 -
 384
384 -
 385
385 -
 386
386 -
 387
387 -
 388
388 -
 389
389 -
 390
390 -
 391
391 -
 392
392 -
 393
393 -
 394
394 -
 395
395 -
 396
396 -
 397
397 -
 398
398 -
 399
399 -
 400
400 -
 401
401 -
 402
402 -
 403
403 -
 404
404 -
 405
405 -
 406
406 -
 407
407 -
 408
408 -
 409
409 -
 410
410 -
 411
411 -
 412
412 -
 413
413 -
 414
414 -
 415
415 -
 416
416 -
 417
417 -
 418
418 -
 419
419 -
 420
420 -
 421
421 -
 422
422 -
 423
423 -
 424
424 -
 425
425 -
 426
426 -
 427
427 -
 428
428 -
 429
429 -
 430
430 -
 431
431 -
 432
432 -
 433
433 -
 434
434 -
 435
435 -
 436
436 -
 437
437 -
 438
438 -
 439
439 -
 440
440 -
 441
441 -
 442
442 -
 443
443 -
 444
444 -
 445
445 -
 446
446 -
 447
447 -
 448
448 -
 449
449 -
 450
450 -
 451
451 -
 452
452 -
 453
453 -
 454
454 -
 455
455 -
 456
456 -
 457
457 -
 458
458 -
 459
459 -
 460
460 -
 461
461 -
 462
462 -
 463
463 -
 464
464 -
 465
465 -
 466
466 -
 467
467 -
 468
468 -
 469
469 -
 470
470 -
 471
471 -
 472
472 -
 473
473 -
 474
474 -
 475
475 -
 476
476 -
 477
477 -
 478
478 -
 479
479 -
 480
480 -
 481
481 -
 482
482 -
 483
483 -
 484
484 -
 485
485 -
 486
486 -
 487
487 -
 488
488 -
 489
489 -
 490
490 -
 491
491 -
 492
492 -
 493
493 -
 494
494 -
 495
495 -
 496
496 -
 497
497 -
 498
498 -
 499
499 -
 500
500 -
 501
501 -
 502
502 -
 503
503 -
 504
504 -
 505
505 -
 506
506 -
 507
507 -
 508
508 -
 509
509 -
 510
510 -
 511
511 -
 512
512 -
 513
513 -
 514
514 -
 515
515 -
 516
516 -
 517
517 -
 518
518 -
 519
519 -
 520
520 -
 521
521 -
 522
522 -
 523
523 -
 524
524 -
 525
525 -
 526
526 -
 527
527 -
 528
528 -
 529
529 -
 530
530 -
 531
531 -
 532
532 -
 533
533 -
 534
534 -
 535
535 -
 536
536 -
 537
537 -
 538
538 -
 539
539 -
 540
540 -
 541
541 -
 542
542 -
 543
543 -
 544
544 -
 545
545 -
 546
546
 |
 |

107
Overview Operating & Financial Review Corporate Governance Financial Statements Shareholder Information
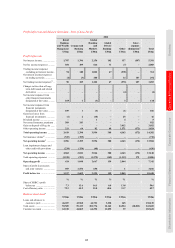
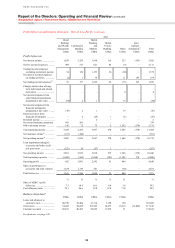
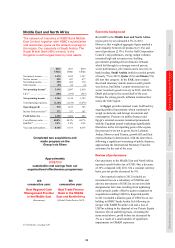
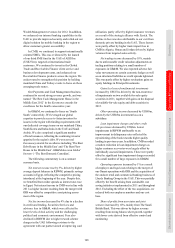
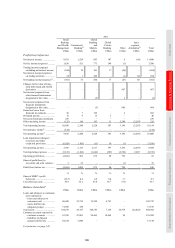
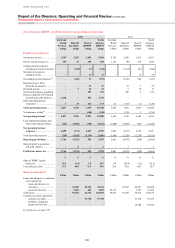
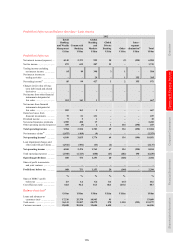
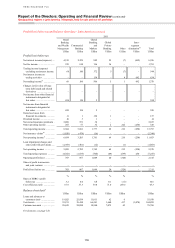
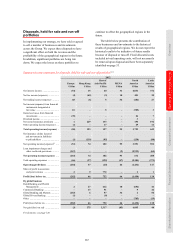
RBWM as long-term interest rates declined to a
lesser extent than in 2011. This was partly offset by
an increase from US$92m in 2011 to US$134m in
2012 of loss provisions for mortgage loan repurchase
obligations related to loans previously sold.
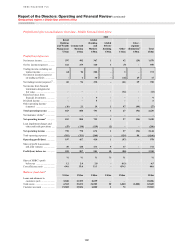
Net trading income increased in GB&M during
2012 as a result of the improved performance of
economic hedges used to manage interest rate risk,
which benefited from a more stable interest rate
environment. Rates revenue was higher due to
increased trading volumes. In addition, credit market
conditions generally reflected tighter credit spreads,
which led to higher income from our credit-related
products. These factors were partly offset by adverse
fair value movements on structured liabilities as own
credit spreads tightened, together with the closure of
our bank notes business in 2011, and a reduction in
foreign exchange revenue as a result of lower trading
volumes in less volatile markets.
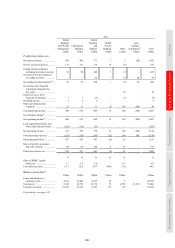
Net loss from financial instruments designated
at fair value was US$1.2bn compared with net gains
of US$964m in 2011. We recognised adverse fair
value movements on our own debt designated at fair
value as credit spreads tightened during 2012, having
widened in 2011. In addition, there were adverse fair
value movements from interest rate ineffectiveness
in the economic hedging of our long-term debt
during the year.
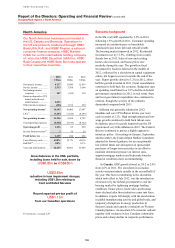
Gains on disposal of US branch network and
cards business included a gain of US$3.1bn from the
sale of the Card and Retail Services business and
US$864m from the sale of 195 retail branches in
upstate New York.
Other operating income increased by US$176m
to US$405m, reflecting lower losses on foreclosed
properties due to the reduction in foreclosure
activity, less deterioration in housing prices during
2012 and, in some markets, improvements in pricing
compared with 2011.
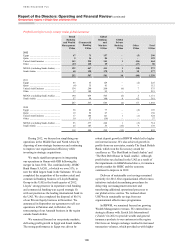
Loan impairment charges and other credit risk
provisions decreased by 51% to US$3.5bn, mainly in
the US, reflecting lower lending balances in CML as
we continued to run off the portfolio, and lower
delinquency levels. Loan impairment charges
remained adversely affected by delays in expected
cash flows from mortgage loans due, in part, to
delays in foreclosure processing and the higher costs
to obtain and realise collateral, although the effects
were less pronounced than in 2011. In addition, loan
impairment charges declined by US$1.3bn due to the
sale of the Card and Retail Services business. These
decreases were partly offset by an adjustment made
following a review completed in the fourth quarter of
2012 which concluded that the estimated average
period of time from current status to write-off was
ten months for real estate loans (previously a period
of seven months was used).
In CMB and GB&M, loan impairment charges
increased, mainly in Bermuda, due to individually
assessed impairments on a small number of
exposures. Credit quality in Canada remained
broadly unchanged.
Operating expenses increased by less than 1% to
US$8.9bn, primarily due to a US$1.5bn charge for
the settlement of investigations noted above.
Compliance costs increased by US$307m, mainly
due to investment in process enhancements and
infrastructure related to anti-money laundering and
Bank Secrecy Act consent orders, along with actions
to address the regulatory consent orders relating to
foreclosure activities. In addition, following a review
of our mortgage foreclosure process, we entered into
an agreement in principle with US regulators to pay
into a fund and provide other customer assistance to
help eligible borrowers who were active in
foreclosure during 2009 and 2010 and were
financially disadvantaged during the process, for
which we recognised a US$104m expense in 2012.
These increases were partly offset by the effect of
the sale of the Card and Retail Services business and
organisational effectiveness initiatives to reduce
costs as we achieved approximately US$230m of
additional sustainable cost savings primarily derived
from operational efficiencies. Average employee
numbers decreased from organisational effectiveness
initiatives and business disposals. In addition,
marketing costs fell and costs of holding foreclosed
properties declined, while software impairment
charges in 2011 did not recur.
