HSBC 2012 Annual Report Download - page 48
Download and view the complete annual report
Please find page 48 of the 2012 HSBC annual report below. You can navigate through the pages in the report by either clicking on the pages listed below, or by using the keyword search tool below to find specific information within the annual report.-
 1
1 -
2
-
3
-
4
-
5
-
6
-
7
-
8
-
9
-
10
-
11
-
12
-
13
-
14
-
15
-
16
-
17
-
18
-
19
-
20
-
21
-
22
-
23
-
24
-
25
-
26
-
27
-
28
-
29
-
30
-
31
-
32
-
33
-
34
-
35
-
36
-
37
-
 38
38 -
 39
39 -
 40
40 -
 41
41 -
 42
42 -
 43
43 -
 44
44 -
 45
45 -
 46
46 -
 47
47 -
 48
48 -
 49
49 -
 50
50 -
 51
51 -
 52
52 -
 53
53 -
 54
54 -
 55
55 -
 56
56 -
 57
57 -
 58
58 -
59
-
60
-
61
-
62
-
63
-
64
-
65
-
66
-
67
-
68
-
69
-
70
-
71
-
72
-
73
-
74
-
75
-
76
-
77
-
78
-
79
-
80
-
81
-
82
-
83
-
84
-
85
-
86
-
87
-
88
-
89
-
90
-
91
-
92
-
93
-
94
-
95
-
96
-
97
-
98
-
99
-
100
-
101
-
102
-
103
-
104
-
105
-
106
-
107
-
108
-
109
-
110
-
111
-
112
-
113
-
114
-
115
-
116
-
117
-
118
-
119
-
120
-
121
-
122
-
123
-
124
-
125
-
126
-
127
-
128
-
129
-
130
-
131
-
132
-
133
-
134
-
135
-
136
-
137
-
138
-
139
-
140
-
141
-
142
-
143
-
144
-
145
-
146
-
147
-
148
-
149
-
150
-
151
-
152
-
153
-
154
-
155
-
156
-
157
-
158
-
159
-
160
-
161
-
162
-
163
-
164
-
165
-
166
-
167
-
168
-
169
-
170
-
171
-
172
-
173
-
174
-
175
-
176
-
177
-
178
-
179
-
180
-
181
-
182
-
183
-
184
-
185
-
186
-
187
-
188
-
189
-
190
-
191
-
192
-
193
-
194
-
195
-
196
-
197
-
198
-
199
-
200
-
201
-
202
-
203
-
204
-
205
-
206
-
207
-
208
-
209
-
210
-
211
-
212
-
213
-
214
-
215
-
216
-
217
-
218
-
219
-
220
-
221
-
222
-
223
-
224
-
225
-
226
-
227
-
228
-
229
-
230
-
231
-
232
-
233
-
234
-
235
-
236
-
237
-
238
-
239
-
240
-
241
-
242
-
243
-
244
-
245
-
246
-
247
-
248
-
249
-
250
-
251
-
252
-
253
-
254
-
255
-
256
-
257
-
258
-
259
-
260
-
261
-
262
-
263
-
264
-
265
-
266
-
267
-
268
-
269
-
270
-
271
-
272
-
273
-
274
-
275
-
276
-
277
-
278
-
279
-
280
-
281
-
282
-
283
-
284
-
285
-
286
-
287
-
288
-
289
-
290
-
291
-
292
-
293
-
294
-
295
-
296
-
297
-
298
-
299
-
300
-
301
-
302
-
303
-
304
-
305
-
306
-
307
-
308
-
309
-
310
-
311
-
312
-
313
-
314
-
315
-
316
-
317
-
318
-
319
-
320
-
321
-
322
-
323
-
324
-
325
-
326
-
327
-
328
-
329
-
330
-
331
-
332
-
333
-
334
-
335
-
336
-
337
-
338
-
339
-
340
-
341
-
342
-
343
-
344
-
345
-
346
-
347
-
348
-
349
-
350
-
351
-
352
-
353
-
354
-
355
-
356
-
357
-
358
-
359
-
360
-
361
-
362
-
363
-
364
-
365
-
366
-
367
-
368
-
369
-
370
-
371
-
372
-
373
-
374
-
375
-
376
-
377
-
378
-
379
-
380
-
381
-
382
-
383
-
384
-
385
-
386
-
387
-
388
-
389
-
390
-
391
-
392
-
393
-
394
-
395
-
396
-
397
-
398
-
399
-
400
-
401
-
402
-
403
-
404
-
405
-
406
-
407
-
408
-
409
-
410
-
411
-
412
-
413
-
414
-
415
-
416
-
417
-
418
-
419
-
420
-
421
-
422
-
423
-
424
-
425
-
426
-
427
-
428
-
429
-
430
-
431
-
432
-
433
-
434
-
435
-
436
-
437
-
438
-
439
-
440
-
441
-
442
-
443
-
444
-
445
-
446
-
447
-
448
-
449
-
450
-
451
-
452
-
453
-
454
-
455
-
456
-
457
-
458
-
459
-
460
-
461
-
462
-
463
-
464
-
465
-
466
-
467
-
468
-
469
-
470
-
471
-
472
-
473
-
474
-
475
-
476
-
477
-
478
-
479
-
480
-
481
-
482
-
483
-
484
-
485
-
486
-
487
-
488
-
489
-
490
-
491
-
492
-
493
-
494
-
495
-
496
-
497
-
498
-
499
-
500
-
501
-
502
-
503
-
504
-
505
-
506
-
507
-
508
-
509
-
510
-
511
-
512
-
513
-
514
-
515
-
516
-
517
-
518
-
519
-
520
-
521
-
522
-
523
-
524
-
525
-
526
-
527
-
528
-
529
-
530
-
531
-
532
-
533
-
534
-
535
-
536
-
537
-
538
-
539
-
540
-
541
-
542
-
543
-
544
-
545
-
546
 |
 |

HSBC HOLDINGS PLC
Report of the Directors: Operating and Financial Review (continued)
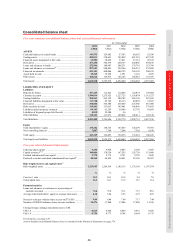
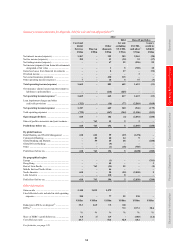
Financial summary > Consolidated balance sheet
46
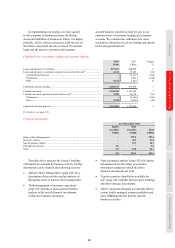
Movement in 2012
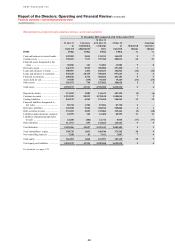
Total reported assets were US$2.7 trillion, 5%
higher than at 31 December 2011. Excluding the
effect of currency movements, total assets increased
by 4%, as shown on page 48.
Our business model (see page 14) and our
approach to managing the Group balance sheet
contributed to our strong liquidity position.
Customer deposits increased by over US$65bn in
2012, which enabled us to continue to support our
customers’ borrowing requirements. Loans and
advances to customers grew by more than US$39bn
during the year, notably in residential mortgages and
term and trade-related lending to corporate and
commercial customers. Higher customer activity
also led to a rise in trading assets.
We have made significant progress in
simplifying and re-shaping our balance sheet to
improve our capital deployment. We completed a
significant number of business disposals during the
year, most notably the Card and Retail Services
business and non-strategic branches in the US. This
led to a significant reduction in ‘Assets held for sale’
with further transactions due to complete in 2013.
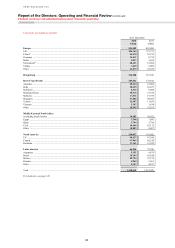
Assets
Cash and balances at central banks rose by 7% as
we placed a greater portion of our surplus liquidity
in Hong Kong, Europe and Rest of Asia-Pacific with
central banks, reflecting both our risk profile and
growth in customer deposits. This was partly offset
by a reduction in North America as liquidity was
redeployed into highly-rated financial investments.
Trading assets increased by 21%. At the end of
2011, client activity fell as eurozone debt concerns
dominated the global economy and, as a result, we
reduced our holdings of debt and equity securities
and did not replace maturities in our reverse repo
book. In 2012, client activity increased from these
subdued levels which resulted in a rise in reverse
repo and securities borrowing balances, together
with higher holdings of equity securities.
Notwithstanding the rise in year-end balances, we
actively managed the trading inventory in GB&M
and the average balance for the year declined by 9%.
Financial assets designated at fair value rose by
8%. Holdings of equity securities in our insurance
businesses in Hong Kong and Europe increased,
reflecting favourable market movements. Portfolio
growth was also partly attributable to net premiums
received in the year.
Derivative assets remained broadly in line with
December 2011 levels. Downward movements in
yield curves in major currencies led to a rise in the
fair value of interest rate contracts, largely in Europe
and, to a lesser extent, the US. This was partly offset
by a decline in the fair value of credit derivative
contracts in Europe and the US, as spreads tightened,
and foreign exchange contracts in Europe reflecting
lower volumes of open trades. In addition, netting
increased from an increase in trading through
clearing houses and a rise in the fair value of interest
rate contracts.
Loans and advances to banks declined by 16%,
driven by a reduction in reverse repo balances in
Europe, in part reflecting the redeployment of
liquidity to central banks, together with maturities
and repayments in Hong Kong and Rest of Asia-
Pacific.
Loans and advances to customers increased by
4%. Residential mortgage balances continued to
grow strongly, following the success of marketing
campaigns and competitive pricing in the UK, the
continued strength in the property market in Hong
Kong and expansion of the distribution network
in Rest of Asia-Pacific. Our focus on corporate and
commercial customers that trade internationally led
to a rise in term and trade-related lending in Hong
Kong and Rest of Asia-Pacific. Lending to CMB
customers also increased in Europe, notably in the
UK despite muted demand for credit, and in North
America, reflecting our focus on target segments in
the US. In the Middle East and North Africa, the rise
in term lending balances followed the completion of
the merger of our operations in Oman with OIB and
the acquisition of the onshore retail and commercial
banking business of Lloyds Banking Group in the
UAE. Corporate overdraft balances which did not
meet netting criteria also increased in the UK, with a
corresponding rise in related customer accounts. The
above movements were partly offset by a reduction
in residential mortgage balances in North America as
a result of repayments and write-offs on the run-off
portfolio. Lending to GB&M customers in Europe
also declined as we reduced our exposure to certain
sectors and disposed of selected positions, and
clients chose to re-finance through the capital
markets. Reverse repo balances also declined,
mainly in Europe.
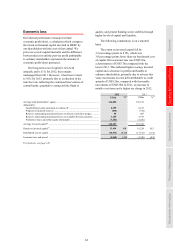
During 2012 we reclassified to ‘Assets held for
sale’ loans and advances to customers relating to the
planned disposals of non-strategic RBWM banking
operations in Rest of Asia-Pacific and businesses in
Latin America and Middle East and North Africa. In
addition, loans and advances to customers, net of
customer allowances, relating to the planned
disposal of non-real estate personal loan balances