HSBC 2012 Annual Report Download - page 190
Download and view the complete annual report
Please find page 190 of the 2012 HSBC annual report below. You can navigate through the pages in the report by either clicking on the pages listed below, or by using the keyword search tool below to find specific information within the annual report.-
 1
1 -
2
-
3
-
4
-
5
-
6
-
7
-
8
-
9
-
10
-
11
-
12
-
13
-
14
-
15
-
16
-
17
-
18
-
19
-
20
-
21
-
22
-
23
-
24
-
25
-
26
-
27
-
28
-
29
-
30
-
31
-
32
-
33
-
34
-
35
-
36
-
37
-
38
-
39
-
40
-
41
-
42
-
43
-
44
-
45
-
46
-
47
-
48
-
49
-
50
-
51
-
52
-
53
-
54
-
55
-
56
-
57
-
58
-
59
-
60
-
61
-
62
-
63
-
64
-
65
-
66
-
67
-
68
-
69
-
70
-
71
-
72
-
73
-
74
-
75
-
76
-
77
-
78
-
79
-
80
-
81
-
82
-
83
-
84
-
85
-
86
-
87
-
88
-
89
-
90
-
91
-
92
-
93
-
94
-
95
-
96
-
97
-
98
-
99
-
100
-
101
-
102
-
103
-
104
-
105
-
106
-
107
-
108
-
109
-
110
-
111
-
112
-
113
-
114
-
115
-
116
-
117
-
118
-
119
-
120
-
121
-
122
-
123
-
124
-
125
-
126
-
127
-
128
-
129
-
130
-
131
-
132
-
133
-
134
-
135
-
136
-
137
-
138
-
139
-
140
-
141
-
142
-
143
-
144
-
145
-
146
-
147
-
148
-
149
-
150
-
151
-
152
-
153
-
154
-
155
-
156
-
157
-
158
-
159
-
160
-
161
-
162
-
163
-
164
-
165
-
166
-
167
-
168
-
169
-
170
-
171
-
172
-
173
-
174
-
175
-
176
-
177
-
178
-
179
-
 180
180 -
 181
181 -
 182
182 -
 183
183 -
 184
184 -
 185
185 -
 186
186 -
 187
187 -
 188
188 -
 189
189 -
 190
190 -
 191
191 -
 192
192 -
 193
193 -
 194
194 -
 195
195 -
 196
196 -
 197
197 -
 198
198 -
 199
199 -
 200
200 -
201
-
202
-
203
-
204
-
205
-
206
-
207
-
208
-
209
-
210
-
211
-
212
-
213
-
214
-
215
-
216
-
217
-
218
-
219
-
220
-
221
-
222
-
223
-
224
-
225
-
226
-
227
-
228
-
229
-
230
-
231
-
232
-
233
-
234
-
235
-
236
-
237
-
238
-
239
-
240
-
241
-
242
-
243
-
244
-
245
-
246
-
247
-
248
-
249
-
250
-
251
-
252
-
253
-
254
-
255
-
256
-
257
-
258
-
259
-
260
-
261
-
262
-
263
-
264
-
265
-
266
-
267
-
268
-
269
-
270
-
271
-
272
-
273
-
274
-
275
-
276
-
277
-
278
-
279
-
280
-
281
-
282
-
283
-
284
-
285
-
286
-
287
-
288
-
289
-
290
-
291
-
292
-
293
-
294
-
295
-
296
-
297
-
298
-
299
-
300
-
301
-
302
-
303
-
304
-
305
-
306
-
307
-
308
-
309
-
310
-
311
-
312
-
313
-
314
-
315
-
316
-
317
-
318
-
319
-
320
-
321
-
322
-
323
-
324
-
325
-
326
-
327
-
328
-
329
-
330
-
331
-
332
-
333
-
334
-
335
-
336
-
337
-
338
-
339
-
340
-
341
-
342
-
343
-
344
-
345
-
346
-
347
-
348
-
349
-
350
-
351
-
352
-
353
-
354
-
355
-
356
-
357
-
358
-
359
-
360
-
361
-
362
-
363
-
364
-
365
-
366
-
367
-
368
-
369
-
370
-
371
-
372
-
373
-
374
-
375
-
376
-
377
-
378
-
379
-
380
-
381
-
382
-
383
-
384
-
385
-
386
-
387
-
388
-
389
-
390
-
391
-
392
-
393
-
394
-
395
-
396
-
397
-
398
-
399
-
400
-
401
-
402
-
403
-
404
-
405
-
406
-
407
-
408
-
409
-
410
-
411
-
412
-
413
-
414
-
415
-
416
-
417
-
418
-
419
-
420
-
421
-
422
-
423
-
424
-
425
-
426
-
427
-
428
-
429
-
430
-
431
-
432
-
433
-
434
-
435
-
436
-
437
-
438
-
439
-
440
-
441
-
442
-
443
-
444
-
445
-
446
-
447
-
448
-
449
-
450
-
451
-
452
-
453
-
454
-
455
-
456
-
457
-
458
-
459
-
460
-
461
-
462
-
463
-
464
-
465
-
466
-
467
-
468
-
469
-
470
-
471
-
472
-
473
-
474
-
475
-
476
-
477
-
478
-
479
-
480
-
481
-
482
-
483
-
484
-
485
-
486
-
487
-
488
-
489
-
490
-
491
-
492
-
493
-
494
-
495
-
496
-
497
-
498
-
499
-
500
-
501
-
502
-
503
-
504
-
505
-
506
-
507
-
508
-
509
-
510
-
511
-
512
-
513
-
514
-
515
-
516
-
517
-
518
-
519
-
520
-
521
-
522
-
523
-
524
-
525
-
526
-
527
-
528
-
529
-
530
-
531
-
532
-
533
-
534
-
535
-
536
-
537
-
538
-
539
-
540
-
541
-
542
-
543
-
544
-
545
-
546
 |
 |

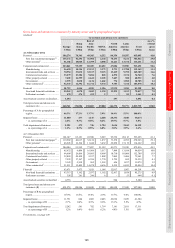
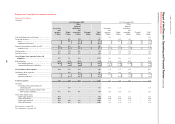
HSBC HOLDINGS PLC
Report of the Directors: Operating and Financial Review (continued)
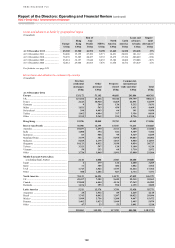
Risk > Credit risk > Securitisation exposures and other structured products
188
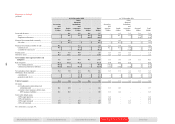
Carrying amount of HSBC’s consolidated holdings of ABSs, and direct lending held at fair value through profit or loss26 (continued)
Trading
Available
for sale
Held to
maturity
Designated
at fair value
through
profit or loss
Loans and
receivables Total
Of which
held through
consolidated
SPEs
Gross
principal
exposure30
Credit
default
swap
protection31
Net
principal
exposure32
US$m US$m US$m US$m US$m US$m US$m US$m US$m US$m
At 31 December 2011
Mortgage-related assets:
Sub-prime residential ................................... 896 2,134 – – 598 3,628 2,367 6,222 275 5,947
Direct lending ........................................... 733 – – – – 733 487 1,684 – 1,684
MBSs and MBS CDOs ............................ 163 2,134 – – 598 2,895 1,880 4,538 275 4,263
US Alt-A residential ..................................... 190 3,516 166 – 243 4,115 2,827 8,610 100 8,510
Direct lending ........................................... 114 – – – – 114 – 119 – 119
MBSs ........................................................ 76 3,516 166 – 243 4,001 2,827 8,491 100 8,391
US Government agency and sponsored
enterprises:
MBSs ........................................................ 38 26,152 1,813 – – 28,003 – 26,498 – 26,498
Other residential ........................................... 670 3,286 – – 978 4,934 2,098 5,702 – 5,702
Direct lending ........................................... 314 – – – – 314 – 309 – 309
MBSs ........................................................ 356 3,286 – – 978 4,620 2,098 5,393 – 5,393
Commercial property
MBSs and MBS CDOs ............................ 300 7,240 – 107 1,816 9,463 5,795 11,222 – 11,222
2,094 42,328 1,979 107 3,635 50,143 13,087 58,254 375 57,879
Leveraged finance-related assets:
ABSs and ABS CDOs .................................. 362 5,566 – – 347 6,275 4,324 7,112 782 6,330
Student loan-related assets:
ABSs and ABS CDOs .................................. 179 4,665 – – 153 4,997 4,114 6,681 199 6,482
Other assets:
ABSs and ABS CDOs .................................. 1,477 2,044 – 94 1,818 5,433 1,473 7,539 1,391 6,148
4,112 54,603 1,979 201 5,953 66,848 22,998 79,586 2,747 76,839
For footnotes, see page 249.
The above table excludes leveraged finance transactions, which are shown separately on page 190.