HSBC 2012 Annual Report Download - page 32
Download and view the complete annual report
Please find page 32 of the 2012 HSBC annual report below. You can navigate through the pages in the report by either clicking on the pages listed below, or by using the keyword search tool below to find specific information within the annual report.-
 1
1 -
2
-
3
-
4
-
5
-
6
-
7
-
8
-
9
-
10
-
11
-
12
-
13
-
14
-
15
-
16
-
17
-
18
-
19
-
20
-
21
-
 22
22 -
 23
23 -
 24
24 -
 25
25 -
 26
26 -
 27
27 -
 28
28 -
 29
29 -
 30
30 -
 31
31 -
 32
32 -
 33
33 -
 34
34 -
 35
35 -
 36
36 -
 37
37 -
 38
38 -
 39
39 -
 40
40 -
 41
41 -
 42
42 -
43
-
44
-
45
-
46
-
47
-
48
-
49
-
50
-
51
-
52
-
53
-
54
-
55
-
56
-
57
-
58
-
59
-
60
-
61
-
62
-
63
-
64
-
65
-
66
-
67
-
68
-
69
-
70
-
71
-
72
-
73
-
74
-
75
-
76
-
77
-
78
-
79
-
80
-
81
-
82
-
83
-
84
-
85
-
86
-
87
-
88
-
89
-
90
-
91
-
92
-
93
-
94
-
95
-
96
-
97
-
98
-
99
-
100
-
101
-
102
-
103
-
104
-
105
-
106
-
107
-
108
-
109
-
110
-
111
-
112
-
113
-
114
-
115
-
116
-
117
-
118
-
119
-
120
-
121
-
122
-
123
-
124
-
125
-
126
-
127
-
128
-
129
-
130
-
131
-
132
-
133
-
134
-
135
-
136
-
137
-
138
-
139
-
140
-
141
-
142
-
143
-
144
-
145
-
146
-
147
-
148
-
149
-
150
-
151
-
152
-
153
-
154
-
155
-
156
-
157
-
158
-
159
-
160
-
161
-
162
-
163
-
164
-
165
-
166
-
167
-
168
-
169
-
170
-
171
-
172
-
173
-
174
-
175
-
176
-
177
-
178
-
179
-
180
-
181
-
182
-
183
-
184
-
185
-
186
-
187
-
188
-
189
-
190
-
191
-
192
-
193
-
194
-
195
-
196
-
197
-
198
-
199
-
200
-
201
-
202
-
203
-
204
-
205
-
206
-
207
-
208
-
209
-
210
-
211
-
212
-
213
-
214
-
215
-
216
-
217
-
218
-
219
-
220
-
221
-
222
-
223
-
224
-
225
-
226
-
227
-
228
-
229
-
230
-
231
-
232
-
233
-
234
-
235
-
236
-
237
-
238
-
239
-
240
-
241
-
242
-
243
-
244
-
245
-
246
-
247
-
248
-
249
-
250
-
251
-
252
-
253
-
254
-
255
-
256
-
257
-
258
-
259
-
260
-
261
-
262
-
263
-
264
-
265
-
266
-
267
-
268
-
269
-
270
-
271
-
272
-
273
-
274
-
275
-
276
-
277
-
278
-
279
-
280
-
281
-
282
-
283
-
284
-
285
-
286
-
287
-
288
-
289
-
290
-
291
-
292
-
293
-
294
-
295
-
296
-
297
-
298
-
299
-
300
-
301
-
302
-
303
-
304
-
305
-
306
-
307
-
308
-
309
-
310
-
311
-
312
-
313
-
314
-
315
-
316
-
317
-
318
-
319
-
320
-
321
-
322
-
323
-
324
-
325
-
326
-
327
-
328
-
329
-
330
-
331
-
332
-
333
-
334
-
335
-
336
-
337
-
338
-
339
-
340
-
341
-
342
-
343
-
344
-
345
-
346
-
347
-
348
-
349
-
350
-
351
-
352
-
353
-
354
-
355
-
356
-
357
-
358
-
359
-
360
-
361
-
362
-
363
-
364
-
365
-
366
-
367
-
368
-
369
-
370
-
371
-
372
-
373
-
374
-
375
-
376
-
377
-
378
-
379
-
380
-
381
-
382
-
383
-
384
-
385
-
386
-
387
-
388
-
389
-
390
-
391
-
392
-
393
-
394
-
395
-
396
-
397
-
398
-
399
-
400
-
401
-
402
-
403
-
404
-
405
-
406
-
407
-
408
-
409
-
410
-
411
-
412
-
413
-
414
-
415
-
416
-
417
-
418
-
419
-
420
-
421
-
422
-
423
-
424
-
425
-
426
-
427
-
428
-
429
-
430
-
431
-
432
-
433
-
434
-
435
-
436
-
437
-
438
-
439
-
440
-
441
-
442
-
443
-
444
-
445
-
446
-
447
-
448
-
449
-
450
-
451
-
452
-
453
-
454
-
455
-
456
-
457
-
458
-
459
-
460
-
461
-
462
-
463
-
464
-
465
-
466
-
467
-
468
-
469
-
470
-
471
-
472
-
473
-
474
-
475
-
476
-
477
-
478
-
479
-
480
-
481
-
482
-
483
-
484
-
485
-
486
-
487
-
488
-
489
-
490
-
491
-
492
-
493
-
494
-
495
-
496
-
497
-
498
-
499
-
500
-
501
-
502
-
503
-
504
-
505
-
506
-
507
-
508
-
509
-
510
-
511
-
512
-
513
-
514
-
515
-
516
-
517
-
518
-
519
-
520
-
521
-
522
-
523
-
524
-
525
-
526
-
527
-
528
-
529
-
530
-
531
-
532
-
533
-
534
-
535
-
536
-
537
-
538
-
539
-
540
-
541
-
542
-
543
-
544
-
545
-
546
 |
 |

HSBC HOLDINGS PLC
Report of the Directors: Operating and Financial Review (continued)
Financial summary > Consolidated income statement
30
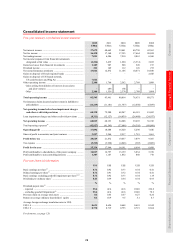
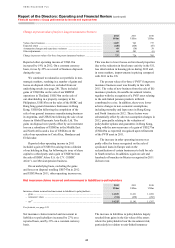
Reported profit before tax of US$20.6bn in 2012
was US$1.2bn, or 6%, lower than in 2011. This was
primarily due to adverse fair value movements on
own debt attributable to credit spreads of US$5.2bn,
compared with favourable movements of US$3.9bn
in 2011. The variance was partially offset by
US$7.5bn of gains (net of losses) on disposals,
in particular in respect of the US Card and Retail
Services business and our associate, Ping An. Our
remaining shareholding in Ping An has been
reclassified as a financial investment (see Note 26 on
the Financial Statements), the sale of which was
completed on 6 February 2013.
We expect disposal of the Card and Retail
Services business in North America and of our
associate shares in Ping An in Rest of Asia-Pacific to
have a significant impact on our profits in each of
these regions for the foreseeable future. In addition,
future profits in Rest of Asia-Pacific are expected to
be affected by the dilution of our shareholding in
Industrial Bank Co. Limited (‘Industrial Bank’),
following its issue of additional share capital to third
parties on 7 January 2013. Our shareholding in
Industrial Bank has now been classified as a financial
investment.
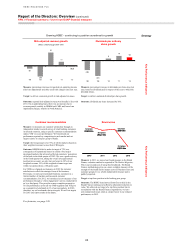
On an underlying basis, profit before tax rose by
18%, primarily due to higher net operating income
before loan impairment charges and other credit risk
provisions (‘revenue’) and lower loan impairment
charges and other credit risk provisions, which were
partially offset by an increase in operating expenses.
The latter was primarily driven by fines and penalties
paid as part of the settlement of investigations into
past inadequate compliance with anti-money
laundering and sanctions laws of US$1.9bn, and a
higher provision for UK customer redress
programmes of US$1.4bn.
The following commentary is on an underlying
basis, except where otherwise stated. The difference
between reported and underlying results is explained
and reconciled on page 26.
Revenue of US$63.5bn was US$4.2bn, or 7%,
higher than in 2011, primarily due to lower adverse
movements on non-qualifying hedges which
accounted for US$1.1bn of the increase, and
revenue growth in GB&M and CMB.
Revenue growth in GB&M mainly reflected
higher Rates and Credit income, notably in Europe,
as spreads tightened and investor sentiment improved
following stimuli by central banks globally.
In CMB, revenue growth primarily reflected
increased net interest income as a result of average
balance sheet growth. Customer loans and advances
grew in all regions, with over half this growth
coming from our faster-growing regions of Hong
Kong, Rest of Asia-Pacific and Latin America,
driven by trade-related lending. In Europe, lending
balances increased, notably in the UK, despite muted
demand for credit. Customer deposits also rose as we
continued to attract deposits through our Payments
and Cash Management products.
Revenue growth in RBWM reflected increased
insurance income, mainly in Hong Kong and Latin
America, which benefited from higher investment
returns and increased sales of life insurance products.
In addition, net interest income grew, mainly in
Hong Kong and Latin America, reflecting higher
average lending and deposit balances. These factors
were partially offset by the continued run-off of our
Consumer and Mortgage Lending (‘CML’) portfolio
in the US.
Loan impairment charges and other credit risk
provisions were US$2.3bn lower than in 2011.
This primarily reflected a decrease in North America,
mainly due to the continued decline in lending
balances and lower delinquency rates in the CML
portfolio. In addition, in Europe there were lower
credit risk provisions on available-for-sale asset-
backed securities (‘ABS’s) driven by an
improvement in underlying asset prices, and lower
loan impairment charges in RBWM, most notably in
the UK, as delinquency rates improved across both
unsecured and secured lending portfolios. These
factors were partially offset by increased loan
impairment charges and other credit risk provisions
in Latin America, particularly in Brazil, which were
primarily due to higher delinquency rates in RBWM
and in Business Banking in CMB. In Rest of Asia-
Pacific, there were also higher individually assessed
loan impairments on a small number of customers in
CMB.
Operating expenses were higher than in 2011,
primarily from fines and penalties paid as part of
the settlement of investigations into past inadequate
compliance with anti-money laundering and
sanctions laws of US$1.9bn, as well as an increase
in provisions relating to UK customer redress
programmes of US$1.4bn. In addition, in 2011
operating expenses included a credit of US$570m
relating to defined benefit pension obligations in the
UK, which did not recur.
The charges for UK customer redress
programmes include estimates in respect of possible
mis-selling in previous years of payment protection
insurance (‘PPI’) policies of US$1.7bn and interest
rate protection products of US$598m. The additional
provision relating to PPI reflects our recent claims