HSBC 2012 Annual Report Download - page 251
Download and view the complete annual report
Please find page 251 of the 2012 HSBC annual report below. You can navigate through the pages in the report by either clicking on the pages listed below, or by using the keyword search tool below to find specific information within the annual report.-
 1
1 -
2
-
3
-
4
-
5
-
6
-
7
-
8
-
9
-
10
-
11
-
12
-
13
-
14
-
15
-
16
-
17
-
18
-
19
-
20
-
21
-
22
-
23
-
24
-
25
-
26
-
27
-
28
-
29
-
30
-
31
-
32
-
33
-
34
-
35
-
36
-
37
-
38
-
39
-
40
-
41
-
42
-
43
-
44
-
45
-
46
-
47
-
48
-
49
-
50
-
51
-
52
-
53
-
54
-
55
-
56
-
57
-
58
-
59
-
60
-
61
-
62
-
63
-
64
-
65
-
66
-
67
-
68
-
69
-
70
-
71
-
72
-
73
-
74
-
75
-
76
-
77
-
78
-
79
-
80
-
81
-
82
-
83
-
84
-
85
-
86
-
87
-
88
-
89
-
90
-
91
-
92
-
93
-
94
-
95
-
96
-
97
-
98
-
99
-
100
-
101
-
102
-
103
-
104
-
105
-
106
-
107
-
108
-
109
-
110
-
111
-
112
-
113
-
114
-
115
-
116
-
117
-
118
-
119
-
120
-
121
-
122
-
123
-
124
-
125
-
126
-
127
-
128
-
129
-
130
-
131
-
132
-
133
-
134
-
135
-
136
-
137
-
138
-
139
-
140
-
141
-
142
-
143
-
144
-
145
-
146
-
147
-
148
-
149
-
150
-
151
-
152
-
153
-
154
-
155
-
156
-
157
-
158
-
159
-
160
-
161
-
162
-
163
-
164
-
165
-
166
-
167
-
168
-
169
-
170
-
171
-
172
-
173
-
174
-
175
-
176
-
177
-
178
-
179
-
180
-
181
-
182
-
183
-
184
-
185
-
186
-
187
-
188
-
189
-
190
-
191
-
192
-
193
-
194
-
195
-
196
-
197
-
198
-
199
-
200
-
201
-
202
-
203
-
204
-
205
-
206
-
207
-
208
-
209
-
210
-
211
-
212
-
213
-
214
-
215
-
216
-
217
-
218
-
219
-
220
-
221
-
222
-
223
-
224
-
225
-
226
-
227
-
228
-
229
-
230
-
231
-
232
-
233
-
234
-
235
-
236
-
237
-
238
-
239
-
240
-
 241
241 -
 242
242 -
 243
243 -
 244
244 -
 245
245 -
 246
246 -
 247
247 -
 248
248 -
 249
249 -
 250
250 -
 251
251 -
 252
252 -
 253
253 -
 254
254 -
 255
255 -
 256
256 -
 257
257 -
 258
258 -
 259
259 -
 260
260 -
 261
261 -
262
-
263
-
264
-
265
-
266
-
267
-
268
-
269
-
270
-
271
-
272
-
273
-
274
-
275
-
276
-
277
-
278
-
279
-
280
-
281
-
282
-
283
-
284
-
285
-
286
-
287
-
288
-
289
-
290
-
291
-
292
-
293
-
294
-
295
-
296
-
297
-
298
-
299
-
300
-
301
-
302
-
303
-
304
-
305
-
306
-
307
-
308
-
309
-
310
-
311
-
312
-
313
-
314
-
315
-
316
-
317
-
318
-
319
-
320
-
321
-
322
-
323
-
324
-
325
-
326
-
327
-
328
-
329
-
330
-
331
-
332
-
333
-
334
-
335
-
336
-
337
-
338
-
339
-
340
-
341
-
342
-
343
-
344
-
345
-
346
-
347
-
348
-
349
-
350
-
351
-
352
-
353
-
354
-
355
-
356
-
357
-
358
-
359
-
360
-
361
-
362
-
363
-
364
-
365
-
366
-
367
-
368
-
369
-
370
-
371
-
372
-
373
-
374
-
375
-
376
-
377
-
378
-
379
-
380
-
381
-
382
-
383
-
384
-
385
-
386
-
387
-
388
-
389
-
390
-
391
-
392
-
393
-
394
-
395
-
396
-
397
-
398
-
399
-
400
-
401
-
402
-
403
-
404
-
405
-
406
-
407
-
408
-
409
-
410
-
411
-
412
-
413
-
414
-
415
-
416
-
417
-
418
-
419
-
420
-
421
-
422
-
423
-
424
-
425
-
426
-
427
-
428
-
429
-
430
-
431
-
432
-
433
-
434
-
435
-
436
-
437
-
438
-
439
-
440
-
441
-
442
-
443
-
444
-
445
-
446
-
447
-
448
-
449
-
450
-
451
-
452
-
453
-
454
-
455
-
456
-
457
-
458
-
459
-
460
-
461
-
462
-
463
-
464
-
465
-
466
-
467
-
468
-
469
-
470
-
471
-
472
-
473
-
474
-
475
-
476
-
477
-
478
-
479
-
480
-
481
-
482
-
483
-
484
-
485
-
486
-
487
-
488
-
489
-
490
-
491
-
492
-
493
-
494
-
495
-
496
-
497
-
498
-
499
-
500
-
501
-
502
-
503
-
504
-
505
-
506
-
507
-
508
-
509
-
510
-
511
-
512
-
513
-
514
-
515
-
516
-
517
-
518
-
519
-
520
-
521
-
522
-
523
-
524
-
525
-
526
-
527
-
528
-
529
-
530
-
531
-
532
-
533
-
534
-
535
-
536
-
537
-
538
-
539
-
540
-
541
-
542
-
543
-
544
-
545
-
546
 |
 |

249
Overview Operating & Financial Review Corporate Governance Financial Statements Shareholder Information
the period 1 January 2011 to 31 December 2013. No
additional special contributions have been agreed.
The HSBC North America (US) Retirement
Income Plan
(Audited)
In 2010, the Investment Committee (the ‘Committee’)
unanimously agreed to transition the Plan’s target
asset allocation mix to 40% equity securities,
59% fixed income securities and 1% cash over a
24-month period. In 2011, the Committee decided
to accelerate this shift to the 2011 year-end and the
target asset allocation mix was maintained during
2012. Should interest rates rise faster than currently
projected by the Committee, a further shift to a
higher percentage of fixed income securities may
be made.
In the third quarter of 2012, it was agreed to
cease all future contributions under the cash balance
formula and freeze the plan with effect from
1 January 2013. While participants with existing
balances continue to receive interest credits until the
account is distributed, they no longer accrue benefits
beginning in 2013.
The most recent actuarial valuation of the plan
to determine compliance with US statutory funding
requirements was made at 1 January 2012 by
Jennifer Jakubowski, Fellow of the Society of
Actuaries, Enrolled Actuary, member of the
American Academy of Actuaries, formerly of
Mercer. At that date, the market value of the plan’s
assets was US$3,194m. The assets represented 118%
of the benefits accrued to members as valued under
the provisions of the Pension Protection Act of 2006
that was effective for the plan year beginning
1 January 2008. The resulting surplus amounted to
US$479m. The method employed for this valuation
was the traditional unit credit method and the
discount rate was determined using a segment rate
method as selected by HSBC under the relevant
regulations, which resulted in an effective interest
rate of 7.13% per annum.
Sustainability risk
(Unaudited)
Assessing the environmental and social
impacts of providing finance to our
customers is integral to our overall risk
management processes.
In 2012, we implemented several changes to
our policies and procedures to streamline our
management of sustainability risks. This ranged
from producing guidelines on how we extend the
Equator Principles beyond project finance into
corporate loans, to technical fixes in our systems
to improve the accuracy of our management
information.
A summary of our current policies and
p
ractices regarding reputational risk, pension
risk and sustainability risk is provided in the
Appendix to Risk on page 278.
Footnotes to Risk
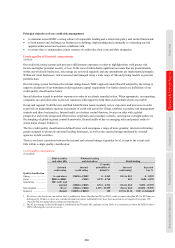
Credit risk
1 ‘Other personal loans and advances’ include second lien mortgages and other property-related lending.
2 ‘Financial’ includes loans and advances to banks.
3 The amount of the loan commitments reflects, where relevant, the expected level of take-up of pre-approved loan offers made by
mailshots to personal customers. In addition to those amounts, there is a further maximum possible exposure to credit risk of US$28bn
(2011: US$171bn), reflecting the full take-up of such irrevocable loan commitments. The take-up of such offers is generally at modest
levels.
4 Includes residential mortgages of HSBC Bank USA and HSBC Finance.
5 Comprising Rest of Asia-Pacific, Middle East and North Africa, and Latin America.
6 HSBC Finance lending is shown on a management basis and includes loans transferred to HSBC USA Inc. which are managed by
HSBC Finance.
7 Property acquired through foreclosure is initially recognised at the lower of the carrying amount of the loan or its fair value less
estimated costs to sell (‘Initial Foreclosed Property Carrying Amount’). The average loss on sale of foreclosed properties is calculated
as cash proceeds less the Initial Foreclosed Properties Carrying Amount divided by the unpaid loan principal balance prior to write-
down (excluding any accrued finance income) plus certain other ancillary disbursements that, by law, are reimbursable from the cash
proceeds (e.g. real estate tax advances) and were incurred prior to our taking title to the property. This ratio represents the portion of
our total loss on foreclosed properties that occurred after we took title to the property.
8 The average total loss on foreclosed properties includes both the loss on sale of the foreclosed property as discussed in footnote 7 and
the cumulative write-downs recognised on the loans up to the time we took title to the property.
9 ‘Other commercial loans and advances’ include advances in respect of agriculture, transport, energy and utilities.
10 Impairment allowances are not reported for financial instruments whereby the carrying amount is reduced directly for impairment and
not through the use of an allowance account.
11 Impairment is not measured for assets held in trading portfolios or designated at fair value as assets in such portfolios are managed
according to movements in fair value, and the fair value movement is taken directly to the income statement. Consequently, we report
all such balances under ‘Neither past due nor impaired’.
12 ‘Loans and advances to customers’ includes asset-backed securities that have been externally rated as strong (2012: US$2.3bn; 2011:
US$3.5bn), good (2012: US$457m; 2011: US$476m), satisfactory (2012: US$390m; 2011: US$428m), sub-standard (2012: US$422m;
2011: US$556m) and impaired (2012: US$259m; 2011: US$229m).