HSBC 2012 Annual Report Download - page 165
Download and view the complete annual report
Please find page 165 of the 2012 HSBC annual report below. You can navigate through the pages in the report by either clicking on the pages listed below, or by using the keyword search tool below to find specific information within the annual report.-
 1
1 -
2
-
3
-
4
-
5
-
6
-
7
-
8
-
9
-
10
-
11
-
12
-
13
-
14
-
15
-
16
-
17
-
18
-
19
-
20
-
21
-
22
-
23
-
24
-
25
-
26
-
27
-
28
-
29
-
30
-
31
-
32
-
33
-
34
-
35
-
36
-
37
-
38
-
39
-
40
-
41
-
42
-
43
-
44
-
45
-
46
-
47
-
48
-
49
-
50
-
51
-
52
-
53
-
54
-
55
-
56
-
57
-
58
-
59
-
60
-
61
-
62
-
63
-
64
-
65
-
66
-
67
-
68
-
69
-
70
-
71
-
72
-
73
-
74
-
75
-
76
-
77
-
78
-
79
-
80
-
81
-
82
-
83
-
84
-
85
-
86
-
87
-
88
-
89
-
90
-
91
-
92
-
93
-
94
-
95
-
96
-
97
-
98
-
99
-
100
-
101
-
102
-
103
-
104
-
105
-
106
-
107
-
108
-
109
-
110
-
111
-
112
-
113
-
114
-
115
-
116
-
117
-
118
-
119
-
120
-
121
-
122
-
123
-
124
-
125
-
126
-
127
-
128
-
129
-
130
-
131
-
132
-
133
-
134
-
135
-
136
-
137
-
138
-
139
-
140
-
141
-
142
-
143
-
144
-
145
-
146
-
147
-
148
-
149
-
150
-
151
-
152
-
153
-
154
-
 155
155 -
 156
156 -
 157
157 -
 158
158 -
 159
159 -
 160
160 -
 161
161 -
 162
162 -
 163
163 -
 164
164 -
 165
165 -
 166
166 -
 167
167 -
 168
168 -
 169
169 -
 170
170 -
 171
171 -
 172
172 -
 173
173 -
 174
174 -
 175
175 -
176
-
177
-
178
-
179
-
180
-
181
-
182
-
183
-
184
-
185
-
186
-
187
-
188
-
189
-
190
-
191
-
192
-
193
-
194
-
195
-
196
-
197
-
198
-
199
-
200
-
201
-
202
-
203
-
204
-
205
-
206
-
207
-
208
-
209
-
210
-
211
-
212
-
213
-
214
-
215
-
216
-
217
-
218
-
219
-
220
-
221
-
222
-
223
-
224
-
225
-
226
-
227
-
228
-
229
-
230
-
231
-
232
-
233
-
234
-
235
-
236
-
237
-
238
-
239
-
240
-
241
-
242
-
243
-
244
-
245
-
246
-
247
-
248
-
249
-
250
-
251
-
252
-
253
-
254
-
255
-
256
-
257
-
258
-
259
-
260
-
261
-
262
-
263
-
264
-
265
-
266
-
267
-
268
-
269
-
270
-
271
-
272
-
273
-
274
-
275
-
276
-
277
-
278
-
279
-
280
-
281
-
282
-
283
-
284
-
285
-
286
-
287
-
288
-
289
-
290
-
291
-
292
-
293
-
294
-
295
-
296
-
297
-
298
-
299
-
300
-
301
-
302
-
303
-
304
-
305
-
306
-
307
-
308
-
309
-
310
-
311
-
312
-
313
-
314
-
315
-
316
-
317
-
318
-
319
-
320
-
321
-
322
-
323
-
324
-
325
-
326
-
327
-
328
-
329
-
330
-
331
-
332
-
333
-
334
-
335
-
336
-
337
-
338
-
339
-
340
-
341
-
342
-
343
-
344
-
345
-
346
-
347
-
348
-
349
-
350
-
351
-
352
-
353
-
354
-
355
-
356
-
357
-
358
-
359
-
360
-
361
-
362
-
363
-
364
-
365
-
366
-
367
-
368
-
369
-
370
-
371
-
372
-
373
-
374
-
375
-
376
-
377
-
378
-
379
-
380
-
381
-
382
-
383
-
384
-
385
-
386
-
387
-
388
-
389
-
390
-
391
-
392
-
393
-
394
-
395
-
396
-
397
-
398
-
399
-
400
-
401
-
402
-
403
-
404
-
405
-
406
-
407
-
408
-
409
-
410
-
411
-
412
-
413
-
414
-
415
-
416
-
417
-
418
-
419
-
420
-
421
-
422
-
423
-
424
-
425
-
426
-
427
-
428
-
429
-
430
-
431
-
432
-
433
-
434
-
435
-
436
-
437
-
438
-
439
-
440
-
441
-
442
-
443
-
444
-
445
-
446
-
447
-
448
-
449
-
450
-
451
-
452
-
453
-
454
-
455
-
456
-
457
-
458
-
459
-
460
-
461
-
462
-
463
-
464
-
465
-
466
-
467
-
468
-
469
-
470
-
471
-
472
-
473
-
474
-
475
-
476
-
477
-
478
-
479
-
480
-
481
-
482
-
483
-
484
-
485
-
486
-
487
-
488
-
489
-
490
-
491
-
492
-
493
-
494
-
495
-
496
-
497
-
498
-
499
-
500
-
501
-
502
-
503
-
504
-
505
-
506
-
507
-
508
-
509
-
510
-
511
-
512
-
513
-
514
-
515
-
516
-
517
-
518
-
519
-
520
-
521
-
522
-
523
-
524
-
525
-
526
-
527
-
528
-
529
-
530
-
531
-
532
-
533
-
534
-
535
-
536
-
537
-
538
-
539
-
540
-
541
-
542
-
543
-
544
-
545
-
546
 |
 |

163
Overview Operating & Financial Review Corporate Governance Financial Statements Shareholder Information
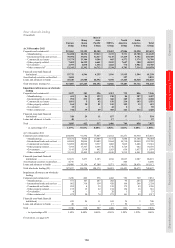
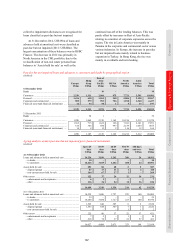
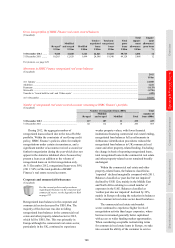
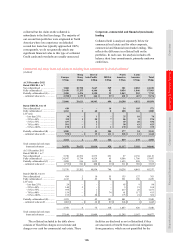
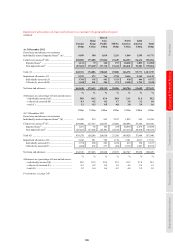
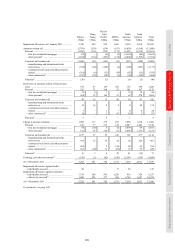
Movement in impaired loans by geographical region
(Unaudited)
Europe
Hong
Kong
Rest of
Asia-
Pacific MENA
North
America
Latin
America Total
US$m US$m US$m US$m US$m US$m US$m
Impaired loans at 1 January 2012 ............................. 11,819 608 1,070 2,445 22,758 3,039 41,739
Personal ................................................................ 2,797 190 388 428 21,094 1,646 26,543
Corporate and commercial ................................... 8,113 372 667 1,798 1,517 1,391 13,858
Financial2 .............................................................. 909 46 15 219 147 2 1,338
Classified as impaired during the year ..................... 3,482 292 924 648 8,130 4,507 17,983
Personal ................................................................ 933 169 549 73 7,363 2,807 11,894
Corporate and commercial ................................... 2,481 123 375 531 739 1,696 5,945
Financial2 .............................................................. 68 – – 44 28 4 144
Transferred from impaired to unimpaired
during the year ...................................................... (1,164) (47) (85) (321) (4,223) (1,765) (7,605)
Personal ................................................................ (279) (38) (69) (32) (4,124) (1,124) (5,666)
Corporate and commercial ................................... (858) (5) (15) (289) (99) (640) (1,906)
Financial2 .............................................................. (27) (4) (1) –– (1) (33)
Amounts written off ................................................. (1,891) (217) (564) (264) (3,514) (2,112) (8,562)
Personal ................................................................ (632) (127) (373) (96) (3,227) (1,521) (5,976)
Corporate and commercial ................................... (1,212) (90) (191) (143) (202) (590) (2,428)
Financial2 .............................................................. (47) – – (25) (85) (1) (158)
Net repayments and other.......................................... (1,101) (159) (198) (34) (2,806) (481) (4,779)
Personal ................................................................ (353) (22) (56) (5) (2,380) (228) (3,044)
Corporate and commercial ................................... (466) (133) (136) (26) (363) (253) (1,377)
Financial2 .............................................................. (282) (4) (6) (3) (63) – (358)
At 31 December 2012 .............................................. 11,145 477 1,147 2,474 20,345 3,188 38,776
Personal ................................................................ 2,466 172 439 368 18,726 1,580 23,751
Corporate and commercial ................................... 8,058 267 700 1,872 1,592 1,604 14,093
Financial2 .............................................................. 621 38 8 234 27 4 932
For footnote, see page 249.
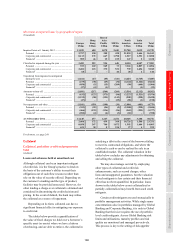
Collateral
Collateral and other credit enhancements
held
(Audited)
Loans and advances held at amortised cost
Although collateral can be an important mitigant
of credit risk, it is the Group’s practice to lend on
the basis of the customer’s ability to meet their
obligations out of cash flow resources rather than
rely on the value of security offered. Depending on
the customer’s standing and the type of product,
facilities may be provided unsecured. However, for
other lending a charge over collateral is obtained and
considered in determining the credit decision and
pricing. In the event of default, the bank may utilise
the collateral as a source of repayment.
Depending on its form, collateral can have a
significant financial effect in mitigating our exposure
to credit risk.
The tables below provide a quantification of
the value of fixed charges we hold over a borrower’s
specific asset (or assets) where we have a history
of enforcing, and are able to enforce, the collateral in
satisfying a debt in the event of the borrower failing
to meet its contractual obligations, and where the
collateral is cash or can be realised by sale in an
established market. The collateral valuation in the
tables below excludes any adjustments for obtaining
and selling the collateral.
We may also manage our risk by employing
other types of collateral and credit risk
enhancements, such as second charges, other
liens and unsupported guarantees, but the valuation
of such mitigants is less certain and their financial
effect has not been quantified. In particular, loans
shown in the tables below as not collateralised or
partially collateralised may benefit from such credit
mitigants.
Certain credit mitigants are used strategically in
portfolio management activities. While single name
concentrations arise in portfolios managed by Global
Banking and Corporate Banking, it is only in Global
Banking that their size requires the use of portfolio
level credit mitigants. Across Global Banking risk
limits and utilisations, maturity profiles and risk
quality are monitored and managed pro-actively.
This process is key to the setting of risk appetite