HSBC 2012 Annual Report Download - page 285
Download and view the complete annual report
Please find page 285 of the 2012 HSBC annual report below. You can navigate through the pages in the report by either clicking on the pages listed below, or by using the keyword search tool below to find specific information within the annual report.-
 1
1 -
2
-
3
-
4
-
5
-
6
-
7
-
8
-
9
-
10
-
11
-
12
-
13
-
14
-
15
-
16
-
17
-
18
-
19
-
20
-
21
-
22
-
23
-
24
-
25
-
26
-
27
-
28
-
29
-
30
-
31
-
32
-
33
-
34
-
35
-
36
-
37
-
38
-
39
-
40
-
41
-
42
-
43
-
44
-
45
-
46
-
47
-
48
-
49
-
50
-
51
-
52
-
53
-
54
-
55
-
56
-
57
-
58
-
59
-
60
-
61
-
62
-
63
-
64
-
65
-
66
-
67
-
68
-
69
-
70
-
71
-
72
-
73
-
74
-
75
-
76
-
77
-
78
-
79
-
80
-
81
-
82
-
83
-
84
-
85
-
86
-
87
-
88
-
89
-
90
-
91
-
92
-
93
-
94
-
95
-
96
-
97
-
98
-
99
-
100
-
101
-
102
-
103
-
104
-
105
-
106
-
107
-
108
-
109
-
110
-
111
-
112
-
113
-
114
-
115
-
116
-
117
-
118
-
119
-
120
-
121
-
122
-
123
-
124
-
125
-
126
-
127
-
128
-
129
-
130
-
131
-
132
-
133
-
134
-
135
-
136
-
137
-
138
-
139
-
140
-
141
-
142
-
143
-
144
-
145
-
146
-
147
-
148
-
149
-
150
-
151
-
152
-
153
-
154
-
155
-
156
-
157
-
158
-
159
-
160
-
161
-
162
-
163
-
164
-
165
-
166
-
167
-
168
-
169
-
170
-
171
-
172
-
173
-
174
-
175
-
176
-
177
-
178
-
179
-
180
-
181
-
182
-
183
-
184
-
185
-
186
-
187
-
188
-
189
-
190
-
191
-
192
-
193
-
194
-
195
-
196
-
197
-
198
-
199
-
200
-
201
-
202
-
203
-
204
-
205
-
206
-
207
-
208
-
209
-
210
-
211
-
212
-
213
-
214
-
215
-
216
-
217
-
218
-
219
-
220
-
221
-
222
-
223
-
224
-
225
-
226
-
227
-
228
-
229
-
230
-
231
-
232
-
233
-
234
-
235
-
236
-
237
-
238
-
239
-
240
-
241
-
242
-
243
-
244
-
245
-
246
-
247
-
248
-
249
-
250
-
251
-
252
-
253
-
254
-
255
-
256
-
257
-
258
-
259
-
260
-
261
-
262
-
263
-
264
-
265
-
266
-
267
-
268
-
269
-
270
-
271
-
272
-
273
-
274
-
 275
275 -
 276
276 -
 277
277 -
 278
278 -
 279
279 -
 280
280 -
 281
281 -
 282
282 -
 283
283 -
 284
284 -
 285
285 -
 286
286 -
 287
287 -
 288
288 -
 289
289 -
 290
290 -
 291
291 -
 292
292 -
 293
293 -
 294
294 -
 295
295 -
296
-
297
-
298
-
299
-
300
-
301
-
302
-
303
-
304
-
305
-
306
-
307
-
308
-
309
-
310
-
311
-
312
-
313
-
314
-
315
-
316
-
317
-
318
-
319
-
320
-
321
-
322
-
323
-
324
-
325
-
326
-
327
-
328
-
329
-
330
-
331
-
332
-
333
-
334
-
335
-
336
-
337
-
338
-
339
-
340
-
341
-
342
-
343
-
344
-
345
-
346
-
347
-
348
-
349
-
350
-
351
-
352
-
353
-
354
-
355
-
356
-
357
-
358
-
359
-
360
-
361
-
362
-
363
-
364
-
365
-
366
-
367
-
368
-
369
-
370
-
371
-
372
-
373
-
374
-
375
-
376
-
377
-
378
-
379
-
380
-
381
-
382
-
383
-
384
-
385
-
386
-
387
-
388
-
389
-
390
-
391
-
392
-
393
-
394
-
395
-
396
-
397
-
398
-
399
-
400
-
401
-
402
-
403
-
404
-
405
-
406
-
407
-
408
-
409
-
410
-
411
-
412
-
413
-
414
-
415
-
416
-
417
-
418
-
419
-
420
-
421
-
422
-
423
-
424
-
425
-
426
-
427
-
428
-
429
-
430
-
431
-
432
-
433
-
434
-
435
-
436
-
437
-
438
-
439
-
440
-
441
-
442
-
443
-
444
-
445
-
446
-
447
-
448
-
449
-
450
-
451
-
452
-
453
-
454
-
455
-
456
-
457
-
458
-
459
-
460
-
461
-
462
-
463
-
464
-
465
-
466
-
467
-
468
-
469
-
470
-
471
-
472
-
473
-
474
-
475
-
476
-
477
-
478
-
479
-
480
-
481
-
482
-
483
-
484
-
485
-
486
-
487
-
488
-
489
-
490
-
491
-
492
-
493
-
494
-
495
-
496
-
497
-
498
-
499
-
500
-
501
-
502
-
503
-
504
-
505
-
506
-
507
-
508
-
509
-
510
-
511
-
512
-
513
-
514
-
515
-
516
-
517
-
518
-
519
-
520
-
521
-
522
-
523
-
524
-
525
-
526
-
527
-
528
-
529
-
530
-
531
-
532
-
533
-
534
-
535
-
536
-
537
-
538
-
539
-
540
-
541
-
542
-
543
-
544
-
545
-
546
 |
 |

283
Overview Operating & Financial Review Corporate Governance Financial Statements Shareholder Information
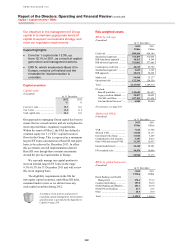
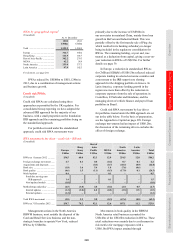
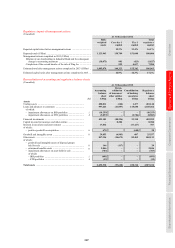
RWAs by geographical regions3
(Unaudited)
At 31 December
2012 2011
US$bn US$bn
Total ........................................... 1,123.9 1,209.5
Europe ........................................ 314.7 340.2
Hong Kong ................................ 111.9 105.7
Rest of Asia-Pacific ................... 302.2 279.3
MENA ........................................ 62.2 58.9
North America ........................... 253.0 337.3
Latin America ............................ 97.9 102.3
For footnote, see page 292.
RWAs reduced by US$86bn to US$1,124bn in
2012, due to a combination of management actions
and business growth.
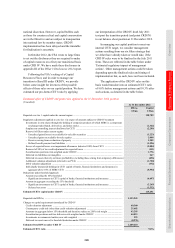
Credit risk RWAs
(Unaudited)
Credit risk RWAs are calculated using three
approaches as permitted by the UK regulator. For
consolidated Group reporting we have adopted the
advanced IRB approach for the majority of our
business, with a small proportion on the foundation
IRB approach and the remaining portfolios being on
the standardised approach.
For portfolios treated under the standardised
approach, credit risk RWA movements were
primarily due to the increase of US$30bn in
our associates in mainland China, mainly from loan
growth in BoCom and Industrial Bank. This was
partially offset by the first tranche sale of Ping An,
which resulted in its banking subsidiary no longer
being included in the regulatory consolidation for
RWAs. The remaining holding, at year end, was
treated as a deduction from capital, giving a year-on-
year reduction in RWAs of US$21bn. For further
details see page 39.
In Europe, a reduction in standardised RWAs
for CMB and GB&M of US$6.5bn reflected reduced
corporate lending in selected eurozone countries and
a movement to the IRB supervisory slotting
approach for the shipping portfolio in Greece. In
Latin America, corporate lending growth in the
region was more than offset by the reduction in
corporate exposure from the sale of operations in
Costa Rica, El Salvador and Honduras, and the
managing down of vehicle finance and payroll loan
portfolios in Brazil.
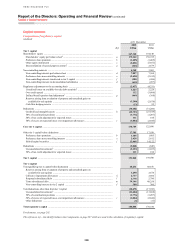
Credit risk RWA movements by key driver
for portfolios treated under the IRB approach are set
out in the table below. For the basis of preparation,
see the Appendix to Capital on page 298. Foreign
exchange movements had an impact of US$6.2bn;
the discussion of the remaining drivers excludes the
effect of foreign exchange.
RWA movement by key driver – credit risk – IRB only
(Unaudited)
Europe
Hong
Kong
Rest of
Asia-
Pacific MENA
North
America
Latin
America Total
US$bn US$bn US$bn US$bn US$bn US$bn US$bn
RWAs at 1 January 2012 ............ 156.5 68.0 82.3 12.9 254.5 12.0 586.2
Foreign exchange movement ...... 4.7 0.1 0.8 (0.2) 0.7 0.1 6.2
Acquisitions and disposals ......... – – (0.1) (0.7) (40.3) (0.9) (42.0)
Book size .................................... (1.8) 3.6 5.4 1.0 (7.6) (0.6) –
Book quality ............................... (6.6) 1.5 (1.1) (0.3) (17.9) 0.1 (24.3)
Model updates ............................. 0.4 – – 0.1 – – 0.5
Portfolios moving onto
IRB approach ..................... 1.4 – – 0.1 – – 1.5
New/updated models .............. (1.0) – – – – – (1.0)
Methodology and policy ............. (2.5) (3.0) 4.8 (0.2) (2.3) 0.5 (2.7)
Internal updates ...................... (1.3) (3.0) 4.8 (0.2) (2.3) 0.5 (1.5)
External updates ..................... (1.2) – – – – – (1.2)
Total RWA movement ............... (5.8) 2.2 9.8 (0.3) (67.4) (0.8) (62.3)
RWAs at 31 December 2012 ...... 150.7 70.2 92.1 12.6 187.1 11.2 523.9
Management actions in the North America
RBWM business, most notably the disposal of the
Card and Retail Services business and the non-
strategic branches in upstate New York, reduced
RWAs by US$40bn.
Movements in book quality in the RBWM
North America retail business accounted for
US$14bn of the US$18bn reduction in RWAs. These
retail reductions were mainly due to a refinement in
risk metrics for mortgage exposures with a
US$6.1bn RWA impact attained through