HSBC 2012 Annual Report Download - page 215
Download and view the complete annual report
Please find page 215 of the 2012 HSBC annual report below. You can navigate through the pages in the report by either clicking on the pages listed below, or by using the keyword search tool below to find specific information within the annual report.-
 1
1 -
2
-
3
-
4
-
5
-
6
-
7
-
8
-
9
-
10
-
11
-
12
-
13
-
14
-
15
-
16
-
17
-
18
-
19
-
20
-
21
-
22
-
23
-
24
-
25
-
26
-
27
-
28
-
29
-
30
-
31
-
32
-
33
-
34
-
35
-
36
-
37
-
38
-
39
-
40
-
41
-
42
-
43
-
44
-
45
-
46
-
47
-
48
-
49
-
50
-
51
-
52
-
53
-
54
-
55
-
56
-
57
-
58
-
59
-
60
-
61
-
62
-
63
-
64
-
65
-
66
-
67
-
68
-
69
-
70
-
71
-
72
-
73
-
74
-
75
-
76
-
77
-
78
-
79
-
80
-
81
-
82
-
83
-
84
-
85
-
86
-
87
-
88
-
89
-
90
-
91
-
92
-
93
-
94
-
95
-
96
-
97
-
98
-
99
-
100
-
101
-
102
-
103
-
104
-
105
-
106
-
107
-
108
-
109
-
110
-
111
-
112
-
113
-
114
-
115
-
116
-
117
-
118
-
119
-
120
-
121
-
122
-
123
-
124
-
125
-
126
-
127
-
128
-
129
-
130
-
131
-
132
-
133
-
134
-
135
-
136
-
137
-
138
-
139
-
140
-
141
-
142
-
143
-
144
-
145
-
146
-
147
-
148
-
149
-
150
-
151
-
152
-
153
-
154
-
155
-
156
-
157
-
158
-
159
-
160
-
161
-
162
-
163
-
164
-
165
-
166
-
167
-
168
-
169
-
170
-
171
-
172
-
173
-
174
-
175
-
176
-
177
-
178
-
179
-
180
-
181
-
182
-
183
-
184
-
185
-
186
-
187
-
188
-
189
-
190
-
191
-
192
-
193
-
194
-
195
-
196
-
197
-
198
-
199
-
200
-
201
-
202
-
203
-
204
-
 205
205 -
 206
206 -
 207
207 -
 208
208 -
 209
209 -
 210
210 -
 211
211 -
 212
212 -
 213
213 -
 214
214 -
 215
215 -
 216
216 -
 217
217 -
 218
218 -
 219
219 -
 220
220 -
 221
221 -
 222
222 -
 223
223 -
 224
224 -
 225
225 -
226
-
227
-
228
-
229
-
230
-
231
-
232
-
233
-
234
-
235
-
236
-
237
-
238
-
239
-
240
-
241
-
242
-
243
-
244
-
245
-
246
-
247
-
248
-
249
-
250
-
251
-
252
-
253
-
254
-
255
-
256
-
257
-
258
-
259
-
260
-
261
-
262
-
263
-
264
-
265
-
266
-
267
-
268
-
269
-
270
-
271
-
272
-
273
-
274
-
275
-
276
-
277
-
278
-
279
-
280
-
281
-
282
-
283
-
284
-
285
-
286
-
287
-
288
-
289
-
290
-
291
-
292
-
293
-
294
-
295
-
296
-
297
-
298
-
299
-
300
-
301
-
302
-
303
-
304
-
305
-
306
-
307
-
308
-
309
-
310
-
311
-
312
-
313
-
314
-
315
-
316
-
317
-
318
-
319
-
320
-
321
-
322
-
323
-
324
-
325
-
326
-
327
-
328
-
329
-
330
-
331
-
332
-
333
-
334
-
335
-
336
-
337
-
338
-
339
-
340
-
341
-
342
-
343
-
344
-
345
-
346
-
347
-
348
-
349
-
350
-
351
-
352
-
353
-
354
-
355
-
356
-
357
-
358
-
359
-
360
-
361
-
362
-
363
-
364
-
365
-
366
-
367
-
368
-
369
-
370
-
371
-
372
-
373
-
374
-
375
-
376
-
377
-
378
-
379
-
380
-
381
-
382
-
383
-
384
-
385
-
386
-
387
-
388
-
389
-
390
-
391
-
392
-
393
-
394
-
395
-
396
-
397
-
398
-
399
-
400
-
401
-
402
-
403
-
404
-
405
-
406
-
407
-
408
-
409
-
410
-
411
-
412
-
413
-
414
-
415
-
416
-
417
-
418
-
419
-
420
-
421
-
422
-
423
-
424
-
425
-
426
-
427
-
428
-
429
-
430
-
431
-
432
-
433
-
434
-
435
-
436
-
437
-
438
-
439
-
440
-
441
-
442
-
443
-
444
-
445
-
446
-
447
-
448
-
449
-
450
-
451
-
452
-
453
-
454
-
455
-
456
-
457
-
458
-
459
-
460
-
461
-
462
-
463
-
464
-
465
-
466
-
467
-
468
-
469
-
470
-
471
-
472
-
473
-
474
-
475
-
476
-
477
-
478
-
479
-
480
-
481
-
482
-
483
-
484
-
485
-
486
-
487
-
488
-
489
-
490
-
491
-
492
-
493
-
494
-
495
-
496
-
497
-
498
-
499
-
500
-
501
-
502
-
503
-
504
-
505
-
506
-
507
-
508
-
509
-
510
-
511
-
512
-
513
-
514
-
515
-
516
-
517
-
518
-
519
-
520
-
521
-
522
-
523
-
524
-
525
-
526
-
527
-
528
-
529
-
530
-
531
-
532
-
533
-
534
-
535
-
536
-
537
-
538
-
539
-
540
-
541
-
542
-
543
-
544
-
545
-
546
 |
 |

213
Overview Operating & Financial Review Corporate Governance Financial Statements Shareholder Information
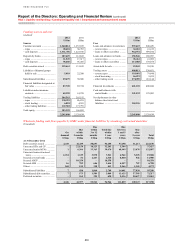
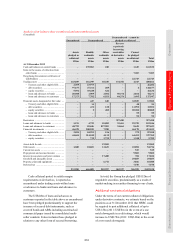
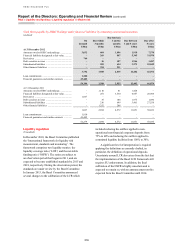
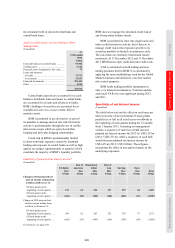
Analysis of on-balance sheet encumbered and unencumbered assets
(Unaudited)
Encumbered Unencumbered
Unencumbered – cannot be
pledged as collateral
Assets
pledged as
collateral
Readily
realisable
assets
Other
realisable
assets
Reverse
repo/stock
borrowing
receivables
& derivative
assets
Cannot
be pledged
as collateral Total
US$m US$m US$m US$m US$m US$m
At 31 December 2012
Cash and balances at central banks ............ – 139,963 220 – 1,349 141,532
Items in the course of collection from
other banks ............................................. – – – – 7,303 7,303
Hong Kong Government certificates of
indebtedness ........................................... – – – – 22,743 22,743
Trading assets ............................................. 143,019 116,395 10,330 134,752 4,315 408,811
– Treasury and other eligible bills ........ 2,309 23,973 –– – 26,282
– debt securities ..................................... 97,157 47,311 205 – 4 144,677
– equity securities .................................. 5,592 35,420 622 – – 41,634
– loans and advances to banks .............. 20,588 1,909 2,582 50,376 2,816 78,271
– loans and advances to customers ....... 17,373 7,782 6,921 84,376 1,495 117,947
Financial assets designated at fair value .... – 447 610 – 32,525 33,582
– Treasury and other eligible bills ........ – 14 – – 40 54
– debt securities ..................................... – 431 128 – 11,992 12,551
– equity securities .................................. – 2 482 – 20,384 20,868
– loans and advances to banks .............. – – – – 55 55
– loans and advances to customers ....... – – – – 54 54
Derivatives .................................................. – – – 357,450 – 357,450
Loans and advances to banks ..................... 1,191 4,722 81,802 35,461 29,370 152,546
Loans and advances to customers .............. 40,792 85,626 827,903 34,664 8,638 997,623
Financial investments ................................. 46,678 300,255 7,990 – 66,178 421,101
– Treasury and other eligible bills ........ 2,024 84,991 156 – 379 87,550
– debt securities ..................................... 44,654 214,545 4,112 – 64,451 327,762
– equity securities .................................. – 719 3,722 – 1,348 5,789
Assets held for sale ..................................... – – 19,269 – – 19,269
Other assets ................................................. 1,600 18,601 11,621 – 22,894 54,716
Current tax assets ........................................ – – – – 515 515
Prepayments and accrued income .............. – – – – 9,502 9,502
Interest in associates and joint ventures ..... – – 17,480 – 354 17,834
Goodwill and intangible assets ................... – – – – 29,853 29,853
Property, plant and equipment .................... – – 6,772 – 3,816 10,588
Deferred tax ................................................ – – – – 7,570 7,570
233,280 666,009 983,997 562,327 246,925 2,692,538
Cash collateral posted to satisfy margin
requirements on derivatives, is reported as
encumbered under trading assets within loans
or advances to banks and loans and advances to
customers.
The US$41bn of loans and advances to
customers reported in the table above as encumbered
have been pledged predominantly to support the
issuance of secured debt instruments, such as
covered bonds and ABSs including asset-backed
commercial paper issued by consolidated multi-
seller conduits. It also includes those pledged in
relation to any other form of secured borrowing.
In total, the Group has pledged US$152bn of
negotiable securities, predominantly as a result of
market-making in securities financing to our clients.
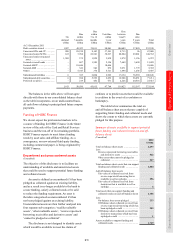
Additional contractual obligations
Under the terms of our current collateral obligations
under derivative contracts, we estimate based on the
positions as at 31 December 2012 that HSBC could
be required to post additional collateral of up to
US$1.5bn (2011: US$3bn) in the event of a one
notch downgrade in credit ratings, which would
increase to US$2.5bn (2011: US$3.8bn) in the event
of a two notch downgrade.