HSBC 2012 Annual Report Download - page 38
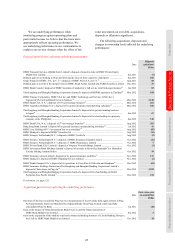
Download and view the complete annual report
Please find page 38 of the 2012 HSBC annual report below. You can navigate through the pages in the report by either clicking on the pages listed below, or by using the keyword search tool below to find specific information within the annual report.-
 1
1 -
2
-
3
-
4
-
5
-
6
-
7
-
8
-
9
-
10
-
11
-
12
-
13
-
14
-
15
-
16
-
17
-
18
-
19
-
20
-
21
-
22
-
23
-
24
-
25
-
26
-
27
-
 28
28 -
 29
29 -
 30
30 -
 31
31 -
 32
32 -
 33
33 -
 34
34 -
 35
35 -
 36
36 -
 37
37 -
 38
38 -
 39
39 -
 40
40 -
 41
41 -
 42
42 -
 43
43 -
 44
44 -
 45
45 -
 46
46 -
 47
47 -
 48
48 -
49
-
50
-
51
-
52
-
53
-
54
-
55
-
56
-
57
-
58
-
59
-
60
-
61
-
62
-
63
-
64
-
65
-
66
-
67
-
68
-
69
-
70
-
71
-
72
-
73
-
74
-
75
-
76
-
77
-
78
-
79
-
80
-
81
-
82
-
83
-
84
-
85
-
86
-
87
-
88
-
89
-
90
-
91
-
92
-
93
-
94
-
95
-
96
-
97
-
98
-
99
-
100
-
101
-
102
-
103
-
104
-
105
-
106
-
107
-
108
-
109
-
110
-
111
-
112
-
113
-
114
-
115
-
116
-
117
-
118
-
119
-
120
-
121
-
122
-
123
-
124
-
125
-
126
-
127
-
128
-
129
-
130
-
131
-
132
-
133
-
134
-
135
-
136
-
137
-
138
-
139
-
140
-
141
-
142
-
143
-
144
-
145
-
146
-
147
-
148
-
149
-
150
-
151
-
152
-
153
-
154
-
155
-
156
-
157
-
158
-
159
-
160
-
161
-
162
-
163
-
164
-
165
-
166
-
167
-
168
-
169
-
170
-
171
-
172
-
173
-
174
-
175
-
176
-
177
-
178
-
179
-
180
-
181
-
182
-
183
-
184
-
185
-
186
-
187
-
188
-
189
-
190
-
191
-
192
-
193
-
194
-
195
-
196
-
197
-
198
-
199
-
200
-
201
-
202
-
203
-
204
-
205
-
206
-
207
-
208
-
209
-
210
-
211
-
212
-
213
-
214
-
215
-
216
-
217
-
218
-
219
-
220
-
221
-
222
-
223
-
224
-
225
-
226
-
227
-
228
-
229
-
230
-
231
-
232
-
233
-
234
-
235
-
236
-
237
-
238
-
239
-
240
-
241
-
242
-
243
-
244
-
245
-
246
-
247
-
248
-
249
-
250
-
251
-
252
-
253
-
254
-
255
-
256
-
257
-
258
-
259
-
260
-
261
-
262
-
263
-
264
-
265
-
266
-
267
-
268
-
269
-
270
-
271
-
272
-
273
-
274
-
275
-
276
-
277
-
278
-
279
-
280
-
281
-
282
-
283
-
284
-
285
-
286
-
287
-
288
-
289
-
290
-
291
-
292
-
293
-
294
-
295
-
296
-
297
-
298
-
299
-
300
-
301
-
302
-
303
-
304
-
305
-
306
-
307
-
308
-
309
-
310
-
311
-
312
-
313
-
314
-
315
-
316
-
317
-
318
-
319
-
320
-
321
-
322
-
323
-
324
-
325
-
326
-
327
-
328
-
329
-
330
-
331
-
332
-
333
-
334
-
335
-
336
-
337
-
338
-
339
-
340
-
341
-
342
-
343
-
344
-
345
-
346
-
347
-
348
-
349
-
350
-
351
-
352
-
353
-
354
-
355
-
356
-
357
-
358
-
359
-
360
-
361
-
362
-
363
-
364
-
365
-
366
-
367
-
368
-
369
-
370
-
371
-
372
-
373
-
374
-
375
-
376
-
377
-
378
-
379
-
380
-
381
-
382
-
383
-
384
-
385
-
386
-
387
-
388
-
389
-
390
-
391
-
392
-
393
-
394
-
395
-
396
-
397
-
398
-
399
-
400
-
401
-
402
-
403
-
404
-
405
-
406
-
407
-
408
-
409
-
410
-
411
-
412
-
413
-
414
-
415
-
416
-
417
-
418
-
419
-
420
-
421
-
422
-
423
-
424
-
425
-
426
-
427
-
428
-
429
-
430
-
431
-
432
-
433
-
434
-
435
-
436
-
437
-
438
-
439
-
440
-
441
-
442
-
443
-
444
-
445
-
446
-
447
-
448
-
449
-
450
-
451
-
452
-
453
-
454
-
455
-
456
-
457
-
458
-
459
-
460
-
461
-
462
-
463
-
464
-
465
-
466
-
467
-
468
-
469
-
470
-
471
-
472
-
473
-
474
-
475
-
476
-
477
-
478
-
479
-
480
-
481
-
482
-
483
-
484
-
485
-
486
-
487
-
488
-
489
-
490
-
491
-
492
-
493
-
494
-
495
-
496
-
497
-
498
-
499
-
500
-
501
-
502
-
503
-
504
-
505
-
506
-
507
-
508
-
509
-
510
-
511
-
512
-
513
-
514
-
515
-
516
-
517
-
518
-
519
-
520
-
521
-
522
-
523
-
524
-
525
-
526
-
527
-
528
-
529
-
530
-
531
-
532
-
533
-
534
-
535
-
536
-
537
-
538
-
539
-
540
-
541
-
542
-
543
-
544
-
545
-
546
 |
 |

HSBC HOLDINGS PLC
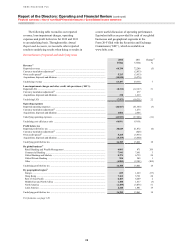
Report of the Directors: Operating and Financial Review (continued)
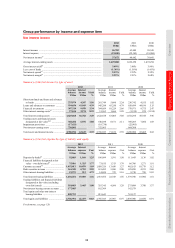
Financial summary > Group performance by income and expense item
36
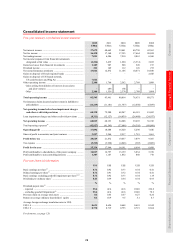
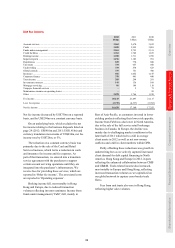
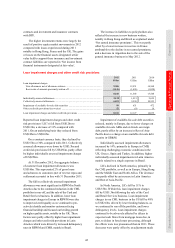
Net trading income
2012
US$m
2011
US$m
2010
US$m
Trading activities ........................................................................................................ 5,249 4,873 5,708
Ping An contingent forward sale contract37 ............................................................... (553) – –
Net interest income on trading activities .................................................................... 2,683 3,223 2,530
Other trading income – hedge ineffectiveness:
– on cash flow hedges ............................................................................................ 35 26 (9)
– on fair value hedges ............................................................................................ (27) (224) 38
Non-qualifying hedges ............................................................................................... (296) (1,392) (1,057)
Net trading income49,50 ................................................................................................ 7,091 6,506 7,210
For footnotes, see page 120.
Reported net trading income of US$7.1bn was
US$585m higher than in 2011. On a constant
currency basis, net trading income rose by
US$849m, driven by lower adverse fair value
movements on non-qualifying hedges. Net income
from trading activities rose in GB&M, but this was
more than offset by lower net interest income on
trading activities and adverse fair value movements
on the contingent forward sale contract relating to
Ping An.
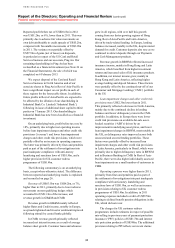
There were lower adverse fair value
movements on non-qualifying hedges. These hedges
are derivatives entered into as part of a documented
interest rate management strategy for which hedge
accounting was not, nor could be, applied. They are
principally cross-currency and interest rate swaps
used to economically hedge fixed rate debt issued
by HSBC Holdings and floating rate debt issued by
HSBC Finance Corporation (‘HSBC Finance’). The
size and direction of the changes in the fair value of
non-qualifying hedges that are recognised in the
income statement can be volatile from year-to-year,
but do not alter the cash flows expected as part of the
documented interest rate management strategy for
both the instruments and the underlying
economically hedged assets and liabilities if the
derivative is held to maturity. In North America,
there were lower adverse fair value movements on
non-qualifying hedges as US long-term interest rates
declined to a lesser extent than in 2011. There were
also lower adverse fair value movements on non-
qualifying hedges in Europe. This was driven by
favourable fair value movements in HSBC Holdings,
compared with adverse fair value movements in
2011, reflecting the less pronounced decline in long-
term US interest rates relative to sterling and euro
interest rates compared with 2011. This was partly
offset by adverse movements in European operating
entities as interest rates fell.
During 2012, HSBC Finance terminated
approximately US$3.0bn of non-qualifying hedges.
A further US$2.4bn of non-qualifying hedges were
terminated in January 2013 to better align our hedges
with the overall interest rate position in HSBC
Finance. The losses on these economic hedges
reported in previous years were therefore crystallised.
Net income from trading activities increased
compared with 2011, driven by a strong performance
in GB&M. This was after taking into account a net
charge of US$385m in the fourth quarter of 2012 as
a result of a change in estimation methodology in
respect of credit valuation adjustments on derivative
assets and debit valuation adjustments on derivative
liabilities to reflect evolving market practices (see
page 441).
Rates revenue was significantly higher, notably
in Europe, as spreads on government debt securities
tightened and investor sentiment improved following
stimuli by central banks. This was despite significant
adverse fair value movements due to own credit
spreads on structured liabilities as spreads tightened,
compared with a gain reported in 2011, together with
a credit valuation adjustment charge of US$837m.
The improvement in market sentiment also led to
tighter spreads on corporate debt securities, resulting
in strong growth in Credit revenue. Foreign
Exchange revenue was broadly in line with 2011, as
higher income resulting from enhanced collaboration
between GB&M and CMB, and increased volumes
from improvements in our electronic pricing and
distribution capabilities, offset the effect of less
volatile markets in 2012. These favourable
movements were partly offset by a reduction in
Equities trading revenue, reflecting a decline in
market volumes together with adverse fair value
movements on structured liabilities as own credit
spreads tightened in 2012, compared with favourable
movements in 2011.
These factors were partly offset by
unfavourable fair value movements on assets held as
economic hedges of foreign currency debt at fair
value compared with favourable movements in 2011,
due to movements in the underlying currencies.
These offset favourable foreign exchange